RESUMEN
In this work, we use the records from 643 goats in order to evaluate the phenotypic relationships between conformation traits and milk production in goats. Correlations were estimated using data on goats which included fifteen conformation traits and first lactation milk yield adjusted for age, calving month and 305 milking days (MY1). We also compared the average scores for type traits on the goats under study with those on a sample of goats from the United States of America (USA). Correlations between conformation traits and MY1 were estimated and an analysis was performed to evaluate the nonlinear relationships between them. The highest correlations were found between milk production and udder depth (–0.22), stature (0.18) and rear udder side view (0.12) (p < 0.05), non-linear (cubic) effects for stature and strength being significant (p < 0.05). American goats had a better overall conformation than the Mexican ones but results indicated that goats with better body conformation were not the best for milk production.
ABSTRACT
Con el objeto de evaluar las relaciones fenotípicas entre características de conformación y la producción de leche en cabras, se utilizó la información de 643 animales. Los datos de las cabras incluyeron quince rasgos de conformación y la producción de leche de la primera lactancia ajustada a edad, mes de parto y 305 días de ordeño (MY1, por sus siglas en inglés). Se compararon también los promedios de las calificaciones de tipo de las cabras de este estudio y de una muestra de cabras de los Estados Unidos de América (USA, por sus siglas en inglés). Se estimaron correlaciones entre las características de conformación con MY1 y se efectuó un análisis para evaluar las relaciones no lineales entre ellas. Las correlaciones más altas fueron entre MY1 y la profundidad de ubre (–0.22), estatura (0.18) y ubre trasera vista de lado (0.12) (p < 0.05) y los efectos no lineales (cúbicos) para estatura y fortaleza resultaron significativos (p < 0.05). Las cabras de USA tuvieron una mejor conformación general que las cabras de México; sin embargo, los resultados indican que las cabras con mejor conformación corporal no fueron las mejores para producir leche.
INTRODUCCIÓN
Conformation traits are those that help an animal to successfully perform its functions and, theoretically, a good conformation should have a direct relationship with productivity, longevity and disease resistance (American Dairy Goat Association [ADGA], 1993; Canadian Goat Society [CGS], 2000). In Canada, the USA and France, data type classifications of goats are obtained to perform genetic evaluations on males and females, which provide information for producers to improve the animal overall conformation, or a specific part of the body (Manfredi, Piacere, Lahaye & Ducroc, 2001). Type traits are evaluated individually, considering biological or linear scale ranges, from 1 to 9 in France and Canada, and 1 to 50 in the USA (ADGA, 1993) and their heritability values (0.16 to 0.33) show adequate genetic variability, allowing them to have good response to selection (Castañeda-Bustos et al., 2016).
However many of metric traits in animals are not independent, but are correlated positive or negatively, due to pleiotropic action of genes (one gene affect two or more traits); correlations are of interest because selecting a trait will cause simultaneous changes in other characters (Falconer, 1996).
The production potential of goats currently depends on breeders properly combining several traits in the selection of animals, including production and type traits. In any animal species, the exclusive selection of a trait, such as milk production, may adversely affect the conformation traits of the animals; for example, the udder may become pendulous in goats with high yields, which in some cases may result in involuntary culling (Valencia & Montaldo, 2005).
Although conformation traits are of interest, it is internationally recognized that the most important economic traits are milk, fat and protein yield. Therefore, they are included as part of the criteria, or index selection, recommended or developed to combine evaluations for total merit of animals (Clement, Manfredi, Piarece, Boichard & Ducroq, 2000; Wiggans & Hubbard, 2001).
Mexico currently has a population of about 9 millions of goats, the second after Brazil, and in the State of Guanajuato there are around 500 thousand heads, so Guanajuato contributes with around 19% of total goat milk production in Mexico and produce almost the same than all the USA (Secretaría de Agricultura, Ganadería, Desarrollo Rural, Pesca y Alimentación-Sistema de Información Agrícola y Pesquera [SAGARPA-SIAP], 2012). In the State of Guanajuato there is a genetic improvement program for dairy goats, which is conducted on thirteen herds in the central region of the country (Torres-Vázquez, Valencia-Posadas, Castillo-Juárez & Montaldo, 2009). The program aims to increase the levels of milk production, improve milk composition (fat, protein, lactose and total solids), diminish the somatic cell count and improve goat conformation. In November 2004, the first evaluation of conformation was conducted, within the framework of the dairy goat improvement project, but that information has not yet been analyzed. To our knowledge, the available scientific information regarding the relationship between conformation traits and milk yield on goats is limited to only a few studies. Manfredi et al. (2001) estimate genetic correlations between predicted breeding values of conformation traits and milk yield on French goats; Ferreira et al. (2013) evaluated only the relationship among type traits in Brazil, while in a study carried out on Mexican goats, Montaldo & Martinez-Lozano (1993) evaluated the association between some udder traits, daily milk yield and the California Mastitis test. However, in a recent study using information from American Dairy Goat Association, Castañeda-Bustos et al. (2016) estimated the genetic correlations between type traits with the real productive life (RPL) and functional productive life (FPL) at 72 months of age. Information about the relationship between type traits and milk is needed to establish adequate selection programs, for example, to properly balance the selection of these traits. It is also important to know the differences between the average conformation scores for USA and Mexican goats, using the same linear appraisal system, in order to make decisions about the improvement of these traits, considering their different production conditions and genetic structure. The objectives of this study were to determine the phenotypic relationship between conformation traits and milk yield in goats and compare the average scores in conformation obtained on goats from Mexico to those on a sample of goats from the United States of America.
MATERIALS AND METHODS
Information about thirteen herds of cattle was used. They belong to the National Association of Breeders of Registered Goats, located mostly in the Municipality of Apaseo el Grande, in the State of Guanajuato (Central Mexico). The area has a temperate dry climate with some rain in the summer (70% of the rainfall is recorded between May and September), a height above mean sea level of 1780 m and an average annual temperature of 19 °C. The coordinates given for the Municipality location are 20° 3’’ N and 100° 48’’ W. The predominant breed is Saanen (approximately 85% of the animals), followed by Toggenburg and Alpina. All the goats herds were in a stall-free feeding system, using mostly dried alfalfa with added commercial concentrates and vitamin and mineral supplements. The husbandry is artificial and milking is done twice a day with automatic equipment. About 70% of the milk produced in the farms is used for cheese production (Valencia, Dobler & Montaldo, 2005).
A total of 1085 lactating goats were classified according to their conformation using the ADGA linear appraisal system (ADGA, 1993). The classification was conducted in November and December 2004 by two official ADGA judges using their own ADGA appraisal system. There were fifteen of the qualified traits: stature, strength, dairyness, rump angle, rump width, rear legs side view, fore udder attachment, rear udder height, rear udder arch, medial suspensory ligament, udder depth, teat placement, teat diameter, rear udder side view and final score. A scale of 50 to 99 points was used for the final score trait, while for all other traits a scale of 1 to 50 points was used. Normality of all conformation traits was assessed using the chi-square goodness of fit test.
Goat scores greater than or equal to 3σ above average were eliminated; the total amount of deleted records was less than 1% of the total. Descriptive statistics of the studied traits were also obtained. First lactation milk yield adjusted for age, month of birth and 305 milking days (MY1) and all the conformation traits were used; information of both MY1 and type traits was recorded for 643 goats.
Prior to the estimation of correlations, a linear statistical model using MY1 (N = 643) as the dependent variable, was used to correct the differences due to the combination of herd-year (as fix effect), with the solutions obtained of the model. After making this correction, Pearson correlations between all traits were estimated. Breed and season effects were not included in the model because both factors were non-significant (p > 0.05). In order to evaluate the possible linear and nonlinear relationships between MY1 with all conformation traits, a forward stepwise, third-degree polynomial regression model was used, where MY1 was considered the response variable, depending on all type traits. The forward stepwise procedure added each of the independent variables to the model, evaluating their level of statistical significance (p < 0.05), the error variance of this model and the contribution of this variable, in order to increase the coefficient of determination (R2). The polynomial model was the following (Stell, Torrie & Dickey, 1997; Weisberg, 1980):
Y = bo + b1(A) + b2(A2) + b3(A3) + b4(B) + b5(B2) + b6(B3) +
… + bn(Q) + bp(Q2) + br(Q3) + e,
where: Y represents the first lactation milk yield corrected to age, month of birth and 305 milking days; bo is the intercept and equals the value of milk production adjusted when all conformation traits are set to zero; bi is the partial regression coefficient of the i-th type trait, from 1 to r; exponents 2 and 3 indicate the quadratic or cubic forms, respectively, of the i-th type trait; the absence of exponent corresponds to the linear form; A, B, .., Q = corresponds to each of the fifteen conformation traits.
The criteria used to compare models were the level of significance of each independent variable (those with p < 0.05) and their contribution to the increase in R2. In addition, this made it possible to evaluate what type traits best explained the variation of MY1.
Type score information of year 2003 for Saanen breed goats provided by the USA Department of Agriculture to the ADGA was used to establish a comparison to the averages scores for the goats under study, focusing on the type qualification points suggested for the 'ideal' goat from the linear appraisal system used in the USA (ADGA, 1993). All statistical analysis were conducting using the Statistical Analysis System program (SAS, 1995).
RESULTS AND DISCUSSION
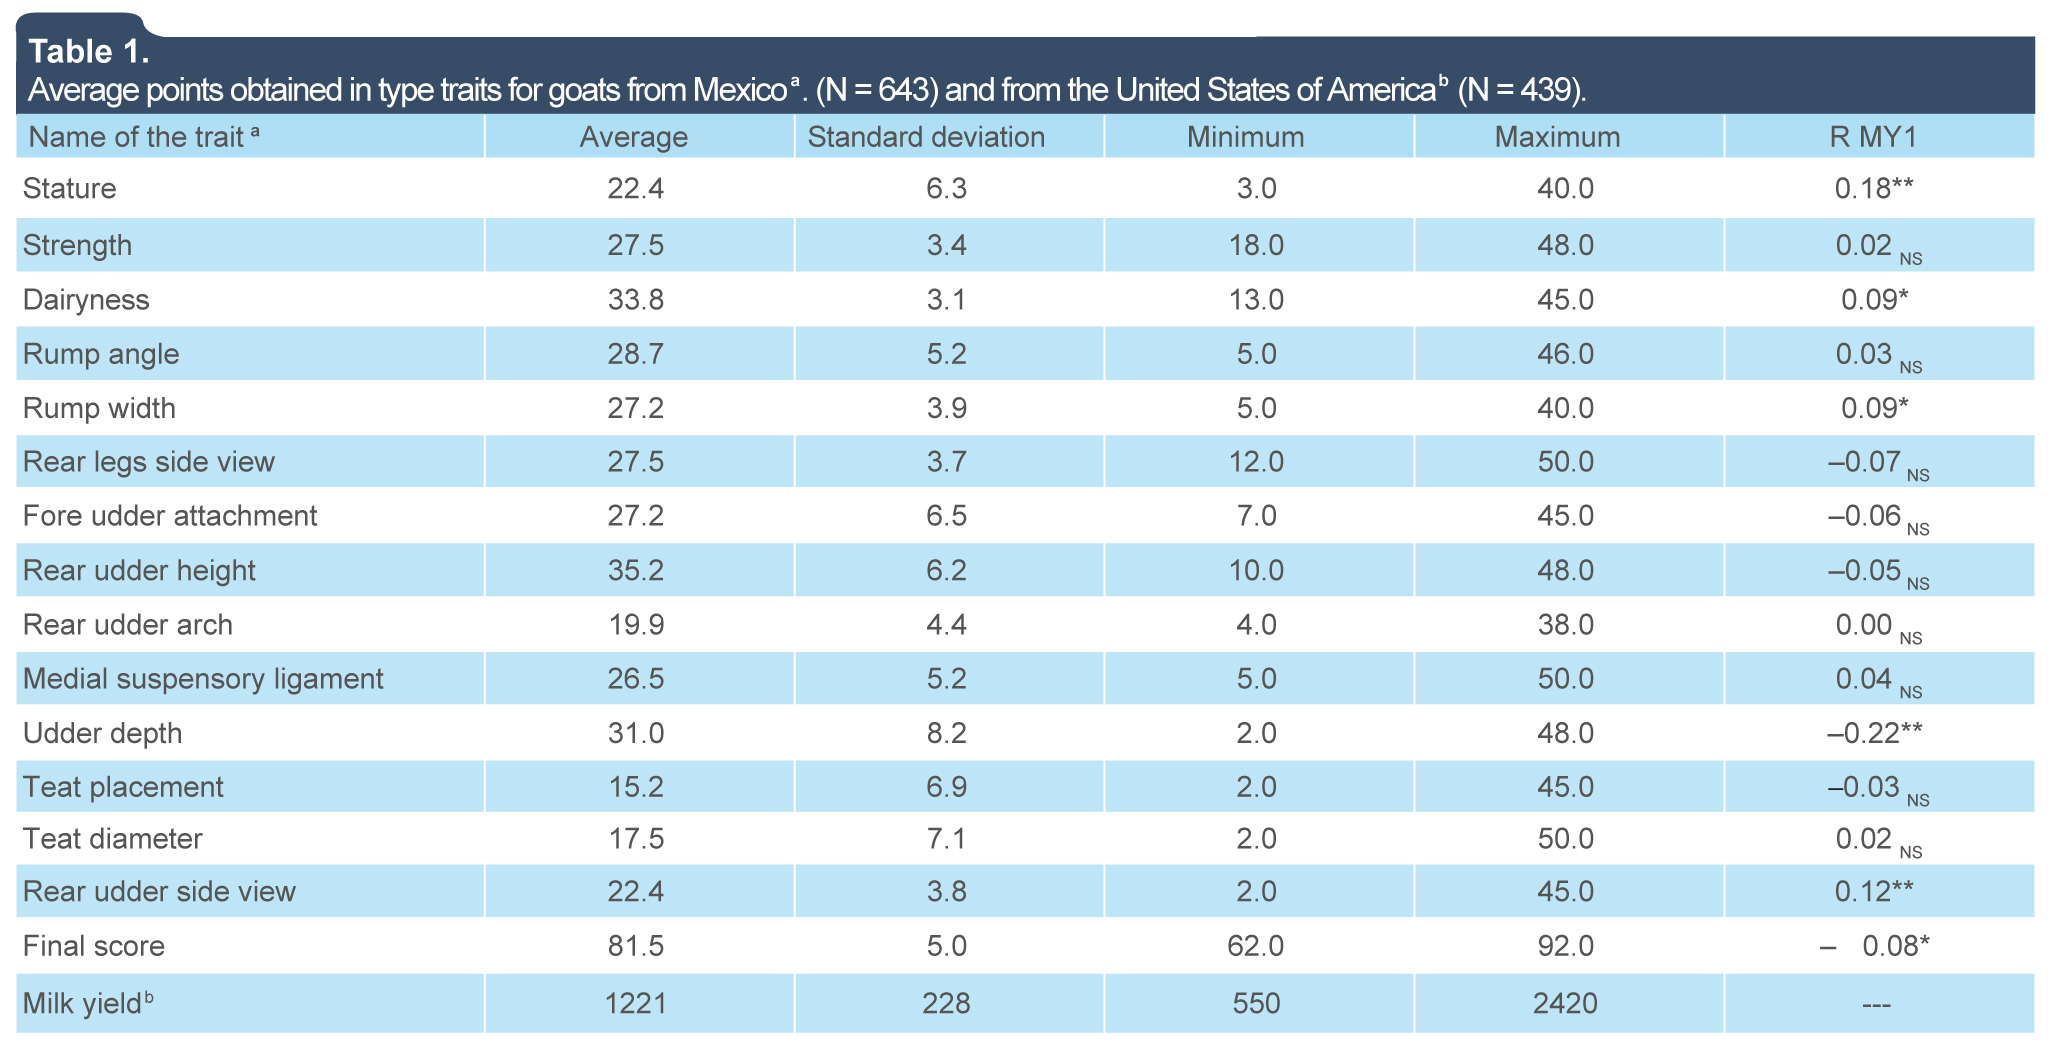
The descriptive statistics for conformation traits and the correlations estimated of them with milk yield appear in table 1.
Table 1.
Descriptive statistics for conformation traits in goats (n = 643) and correlations (R) with first lactation milk yield (MY1).
|
|
Name of the traita
|
Average
|
Standard deviation
|
Minimum
|
Maximum
|
R MY1
|
|
Stature
|
22.4
|
6.3
|
3.0
|
40.0
|
0.18**
|
|
Strength
|
27.5
|
3.4
|
18.0
|
48.0
|
0.02NS
|
|
Dairyness
|
33.8
|
3.1
|
13.0
|
45.0
|
0.09*
|
|
Rump angle
|
28.7
|
5.2
|
5.0
|
46.0
|
0.03NS
|
|
Rump width
|
27.2
|
3.9
|
5.0
|
40.0
|
0.09*
|
|
Rear legs side view
|
27.5
|
3.7
|
12.0
|
50.0
|
-0.07NS
|
|
Fore udder attachment
|
27.2
|
6.5
|
7.0
|
45.0
|
-0.06NS
|
|
Rear udder height
|
35.2
|
6.2
|
10.0
|
48.0
|
-0.05NS
|
|
Rear udder arch
|
19.9
|
4.4
|
4.0
|
38.0
|
0.00NS
|
|
Medial suspensory ligament
|
26.5
|
5.2
|
5.0
|
50.0
|
0.04NS
|
|
Udder depth
|
31.0
|
8.2
|
2.0
|
48.0
|
-0.22**
|
|
Teat placement
|
15.2
|
6.9
|
2.0
|
45.0
|
-0.03NS
|
|
Teat diameter
|
17.5
|
7.1
|
2.0
|
50.0
|
0.02NS
|
|
Rear udder side view
|
22.4
|
3.8
|
2.0
|
45.0
|
0.12**
|
|
Final score
|
81.5
|
5.0
|
62.0
|
92.0
|
- 0.08*
|
|
Milk yieldb
|
1221
|
228
|
550
|
2420
|
---
|
a = the measuring unit of type traits was points on a scale of 1 to 50, except for the final score that was measured on a scale of 50 to 99 points; b = milk yield was measured in kilograms; the level of significance appears next to the values of the correlations: * = (p < 0.05); ** = (p < 0.01); NS = not significant.
Source: Author's own elaboration
Abrir
 |
a = the measuring unit of type traits was points on a scale of 1 to 50, except for the final score that was measured on a scale of 50 to 99 points; b = milk yield was measured in kilograms; the level of significance appears next to the values of the correlations: * = (p < 0.05); ** = (p < 0.01); NS = not significant.
Source: Author's own elaboration Close
The averages for conformation traits were 15.2 to 35.2 points for the teat placement (minimum) and rear udder height (maximum) variables, respectively. The average final score was 81.5 points with a standard deviation of 5 points. The minimum and maximum values for most of the evaluated traits were very widely separated, suggesting an important variation in the qualification of these traits between the classified animals. Correlations estimated between MY1 and type traits in general were low (from –0.22 to 0.18). The highest correlations obtained in this study were between MY1 and: udder depth (–0.22), stature (0.18), rear udder side view (0.12), dairyness (0.09), rump width (0.09) and final score (–0.08) (p < 0.05).
The estimated correlation between MY1 and the final score was negative and close to zero (–0.08). In a study conducted on Mexican goats, Montaldo & Martinez-Lozano (1993) evaluated the relationship between some udder traits and the daily milk yield; the diameter of the udder and the teat diameter had positive correlations of 0.81 and 0.45, respectively. In Brazil, a study conducted on dairy goats evaluated the associations between 18 conformation traits, excluding milk production (Ferreira et al., 2013). For dairy cattle, Short & Lawlor (1992) also found a low positive phenotypic relationship between MY1 and the final score, whose value was 0.15, on a Holstein cow population from the USA.
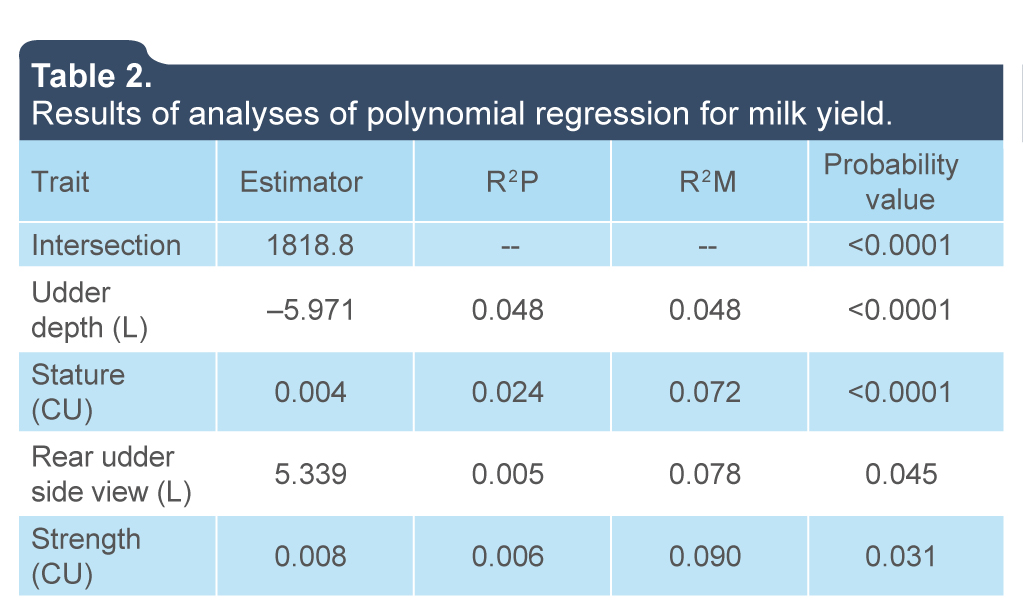
Table 2 shows the results of the polynomial regression analysis for milk yield. The table presents, in ascending order, the conformation traits that best explained the variation showed by milk yield, and all of them were significant (p < 0.05).
Table 2.
Results of analyses of polynomial regression for milk yield.
|
|
Trait
|
Estimator
|
R2P
|
R2M
|
Probability value
|
|
Intersection
|
1818.8
|
--
|
--
|
<0.0001
|
|
Udder depth (L)
|
–5.971
|
0.048
|
0.048
|
<0.0001
|
|
Stature (CU)
|
0.004
|
0.004
|
0.072
|
<0.0001
|
|
Rear udder side view (L)
|
5.339
|
0.005
|
0.078
|
0.045
|
|
Strength (CU)
|
0.008
|
0.006
|
0.090
|
0.031
|
R2P = partial determination coefficient; R2M = determination coefficient of the model; L = linear form; CU = cubic form.
Source: Author's own elaboration
Abrir
 |
R2P = partial determination coefficient; R2M = determination coefficient of the model; L = linear form; CU = cubic form.
Source: Author's own elaboration Close
Udder depth, rear udder side view and strength traits in their linear forms were significant (p < 0.05), as were the cubic effects for stature and strength (p < 0.05); the linear effect of the strength trait had a probability close to the level of significance (p = 0.056). One way to interpret the estimated value of bi (partial regression coefficient) using its definition (Steel et al., 1997), for example, for udder depth, would be to argue that for each additional point in udder depth the milk yield per lactation decreases 5.971 kg, suggesting a negative association between these two traits. Table 2 also shows that the contribution of each type trait in increasing R2 was, in general, low and that the R2 of the model that explains the final MY1 variation due to the type traits was also low (9%). This may be caused by the presence of other important variation sources that directly influence MY1, such as those associated with the animals' genotype, the flock conditions (food, health, management, facilities, etc.), their age, season and year of birth, calving month and the number of daily milkings, among others (Analla, Jiménez, Muñoz, Serradilla & Falagan, 1996; Castañeda-Bustos et al., 2014; Valencia, Dobler & Arbiza, 2002; Valencia et al., 2005).
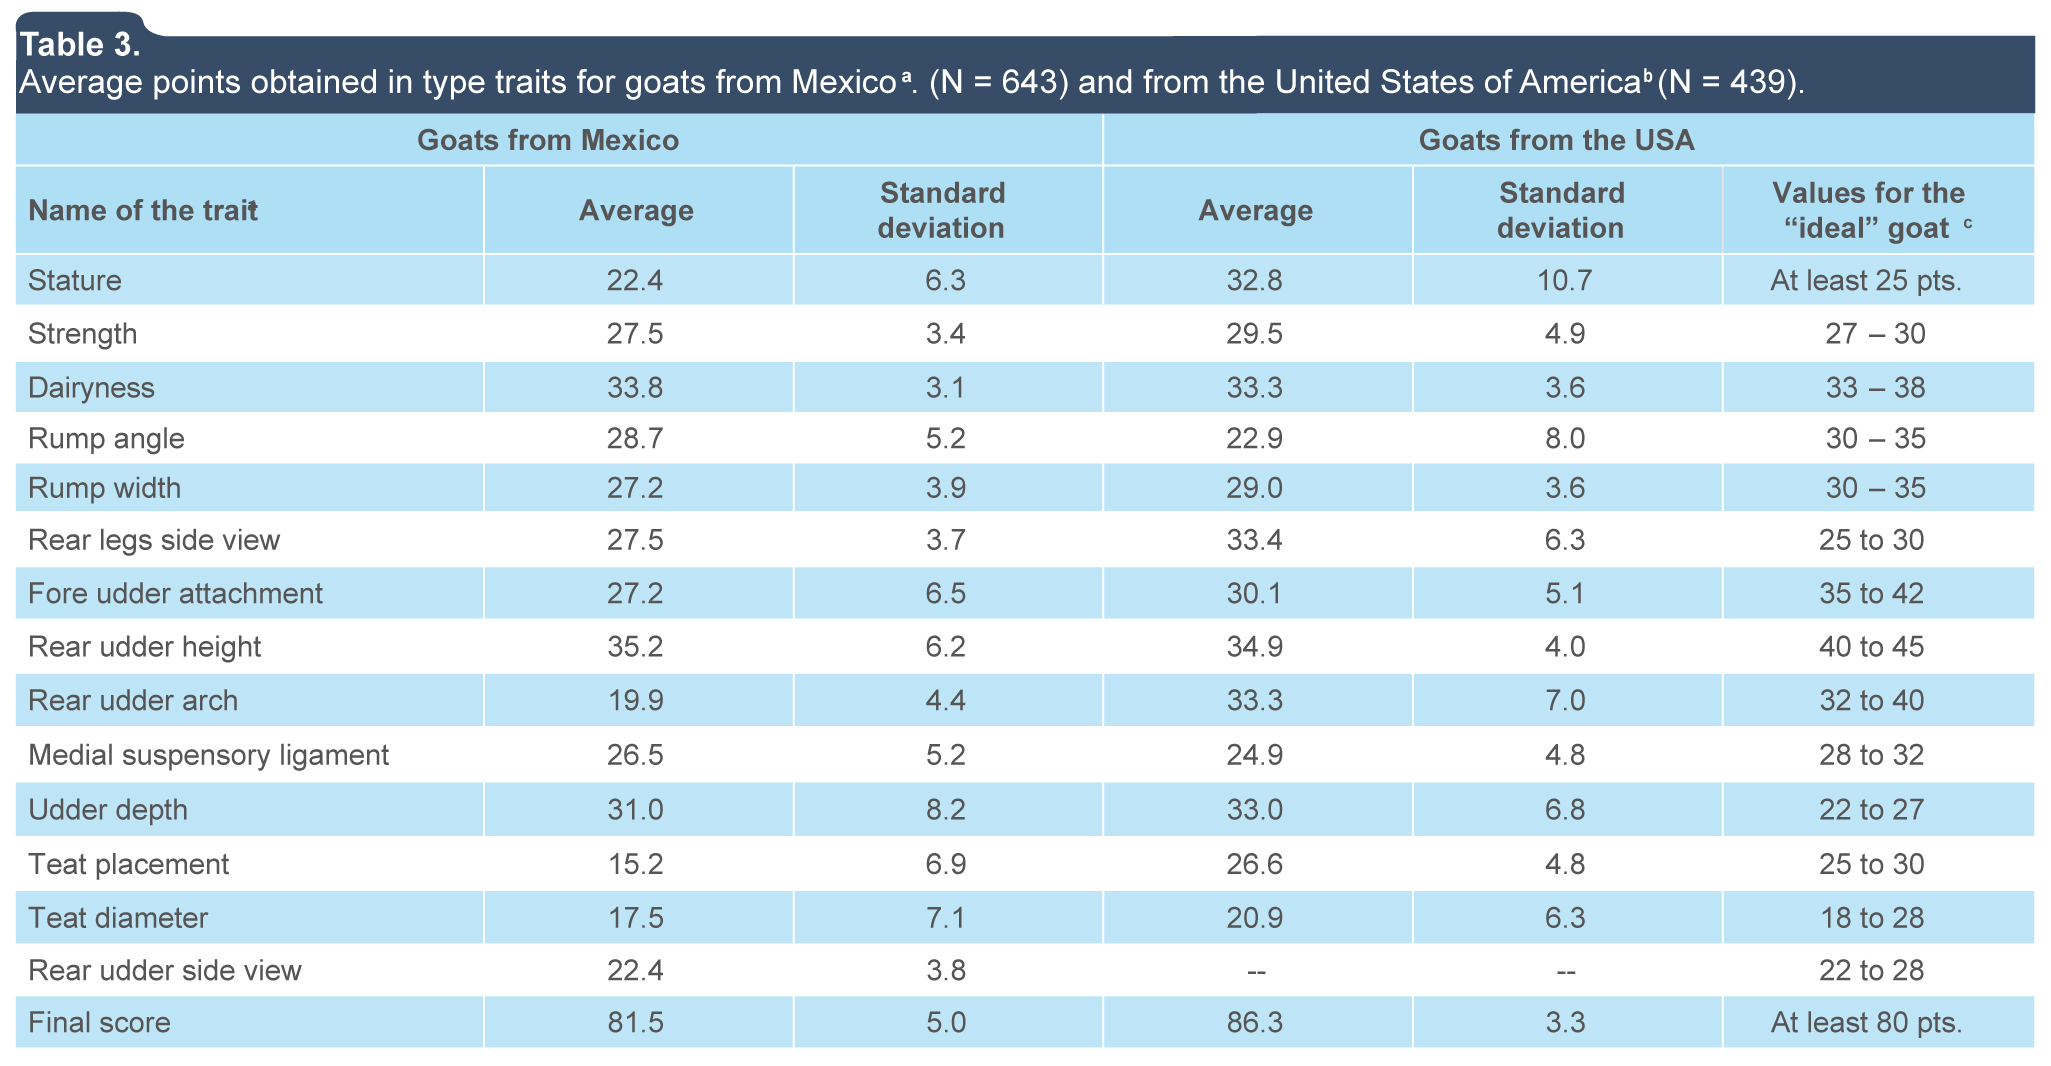
Table 3 presents the average of points obtained for Saanen goats from the USA and the average for goats under study, recognizing that the compared populations have different genetic structure and live in different production conditions.
Table 3.
Average points obtained in type traits for goats from Mexicoa. (N = 643) and from the United States of Americab (N = 439).
|
|
Goats from Mexico
|
Goats from the USA
|
|
Name of the traita
|
Average
|
Standard deviation
|
Average
|
Standard
deviation
|
Values for the
“ideal” goatc
|
|
Stature
|
22.4
|
6.3
|
3.0
|
40.0
|
0.18**
|
|
Strength
|
27.5
|
3.4
|
18.0
|
48.0
|
0.02NS
|
|
Dairyness
|
33.8
|
3.1
|
13.0
|
45.0
|
0.09*
|
|
Rump angle
|
28.7
|
5.2
|
5.0
|
46.0
|
0.03NS
|
|
Rump width
|
27.2
|
3.9
|
5.0
|
40.0
|
0.09*
|
|
Rear legs side view
|
27.5
|
3.7
|
12.0
|
50.0
|
-0.07NS
|
|
Fore udder attachment
|
27.2
|
6.5
|
7.0
|
45.0
|
-0.06NS
|
|
Rear udder height
|
35.2
|
6.2
|
10.0
|
48.0
|
-0.05NS
|
|
Rear udder arch
|
19.9
|
4.4
|
4.0
|
38.0
|
0.00NS
|
|
Medial suspensory ligament
|
26.5
|
5.2
|
5.0
|
50.0
|
0.04NS
|
|
Udder depth
|
31.0
|
8.2
|
2.0
|
48.0
|
-0.22**
|
|
Teat placement
|
15.2
|
6.9
|
2.0
|
45.0
|
-0.03NS
|
|
Teat diameter
|
17.5
|
7.1
|
2.0
|
50.0
|
0.02NS
|
|
Rear udder side view
|
22.4
|
3.8
|
2.0
|
45.0
|
0.12**
|
|
Final score
|
81.5
|
5.0
|
62.0
|
92.0
|
- 0.08*
|
|
Milk yieldb
|
1221
|
228
|
550
|
2420
|
---
|
a = Goats with at least one calving. b = Records adjusted to age. Courtesy of Mrs Sheila Nixon (American Dairy Goat Association). c = Reference values for each trait recommended by the American Dairy Goat Association.
Source: Author's own elaboration
Abrir
 |
a = Goats with at least one calving. b = Records adjusted to age. Courtesy of Mrs Sheila Nixon (American Dairy Goat Association). c = Reference values for each trait recommended by the American Dairy Goat Association.
Source: Author's own elaboration Close
In the linear appraisal system used in the USA, the stature of an ideal goat is classified intermediate to high; 30 in goats (measured to the top of the withers) are considered intermediate and assigned 25 points, while at least 34 in goats are considered extremely high and are assigned 45 points or more. According to the averages obtained in both populations and the range of ideal points for stature, American goats can be classified as middle and slightly higher, while Mexicans are small. Furthermore, the final average score for the later was lower than for the former (81.5 vs 86.3), suggesting a better overall animal conformation in the USA, using this appraisal system of goats.
The linear appraisal system used in this study to score Mexican goats, which is also used in the USA, is a guide and should be used with caution since it is almost impossible to define the ideal scores for a dairy goat without neglecting yield traits, especially in populations with different production systems. Although the effect of breed was not included in the statistical model used in this study, (it was of non-significant effect, p > 0.05, as we previously mentioned) results are reliable because the most qualified goats belonged to the Saanen breed (around 85%).
New fields of research in conformation traits in goats should be attended or developed. For example, in Angora goats, Marrube et al. (2007) found the existence of chromosomal regions involved in conformation traits in Angora goats, and it represents the first research work in some specific genome sections in order to identify and characterize the genetic variability involved in these traits.
Type classification allows producers to know the strengths and weaknesses in different areas or regions of the body of the animal, to improve by selection, for example, using semen from sires positively evaluated for production traits and positive evaluations for type traits. This can increase the opportunity of a positive change in the improvement by selection of these traits. The type traits should be considered as secondary in selection programs for dairy goats, because animal owners have the main revenues based on milk, fat and protein yields.
CONCLUSIONS
The correlations obtained in this study between type traits and first lactation milk yield were low, in general. The highest correlations were found between milk yield and udder depth, stature, rear udder side view, dairyness, rump width and final score. Nonlinear relationships were more intense between milk yield and stature and strength in their cubic forms. Taking into account the linear appraisal system used in this study, the goats from United States had a higher average final score than goats from Mexico, indicating a better overall animal conformation. The results indicated that goats with better body conformation were not the best to produce milk. However, these relationships are phenotypic thereby including environmental effects that can influence two traits simultaneously.
ACKNOWLEDGEMENTS
The authors gratefully acknowledge the University of Guanajuato (Dirección de Apoyo a la Investigación y al Posgrado [DAIP]) for the financial support received for the Project No. 15 at the Institutional Call for Strengthening Academic Excellence 2015. We also thank the National Association of Breeders of Registered Goats and to Ms. Sheila Nixon (American Dairy Goat Association) by the information provided for this study.
REFERENCIAS
American Dairy Goat Association (ADGA). (1993). Linear appraisal system for dairy goats. ADGA, Spindale, NC 28160, USA, p.18.
Analla, M., Jiménez, I., Muñoz, A., Serradilla, J., & Falagan, A. (1996). Estimation of genetic parameters for milk yield and fat protein contents of milk of Murciano-Granadina goats. Journal Dairy Science, 79, 1895-1898.
Canadian Goat Society (CGS). (2000). Enhanced type classification members handbook. CGS. Ontario, Canada, p. 21.
Castañeda-Bustos, V. J., Montaldo, H. H., Torres-Hernández, G., Pérez-Elizalde, S., Valencia-Posadas, M., Hernández-Mendo, O., & Shepard, L. (2014). Estimation of genetic parameters for productive life, reproduction, and milk-production traits in US dairy goats. Journal Dairy Science, 97(4), 2462-2473.
Castañeda-Bustos, V. J., Montaldo, H. H., Torres-Hernández, G., Pérez-Elizalde, S., Valencia-Posadas, M., Hernández-Mendo, O., & Shepard, L. (2016). Linear and non-linear genetic relationships between type traits and productive life in US dairy goats. Journal Dairy Sciencie. Accepted with minor revision (in second revision).
Clement, V., Manfredi, E., Piacere, A., Boichard, D., & Ducroq, V. (2000). Genetic evaluation of dairy goats in France. Symposium Satellite: Applied Genetic Programs for Dairy Goats. Futuroscope, Poiters, 1-4.
Falconer, D. S. (1996). Introduction to Quantitative Genetics (4th ed.), Pearson: United Kingdom, p. 480.
Ferreira, T. A., Garcia, P. I., Guimarães, G. A. M., Vieira, P. A., Facó, O., Tângari, M. C., Ferreira, F. A. I., & Souza, L. M. de P. G. I. (2013). Morphological traits and type of dairy goats registered in Brazil from 1976 to 2009. Revista Brasileira de Zootecnia, 42(12), 857-861.
Manfredi, E., Piacere, A., Lahaye, P., & Ducroc, V. (2001). Genetic parameters of type appraisal in Saanen and Alpine goats. Livestock Production Science, 70, 183-189.
Marrube, G., Canob, E. M., Roldánb, D. L., Bidinostc, F., Abadc, M., Allaind, D., Vaimane, D., Taddeoc, H. & Polib, M. A. (2007). QTL affecting conformation traits in Angora goats. Small Ruminant Research, 71, 255-263.
Montaldo, H. H. & Martínez-Lozano, F. J. (1993). Phenotypic relationships between udder and milking characteristics, milk production and California mastitis test in goats. Small Ruminant Research, 12 12(3), 329-337.
Secretaría de Agricultura, Ganadería, Desarrollo Rural, Pesca y Alimentación (SAGARPA-SIAP). (2012). Sistema de Información Agrícola y Pesquera SIAP. Retrieved November 12, 2012 from www.sagarpa.gov.mx
Statistical Analysis System (SAS). (1995). User’s Guide. Cary, North Carolina, SAS Institute Inc., US. 422 pp.
Short, T. H., & Lawlor, T. J. (1992). Genetic parameters of conformation traits, milk yield, and herd life in Holstein. Journal Dairy Science, 75, 1987-1998. doi: 10.3168/jds.S0022-0302(92)77958-2
Steel, R. G., Torrie, J. H., & Dickey, D. A. (1997). Principles and Procedures of Statistics: A Biometrical Approach, 3 Sub Edition, New York, McGraw-Hill.
Torres-Vázquez, J. A., Valencia-Posadas, M., Castillo-Juárez, H., & Montaldo, H. H. (2009). Genetic and phenotypic parameters of milk yield, milk composition and age at first kidding in Saanen goats from Mexico. Livestock Science, 126, 147-153.
Valencia, P. M., Dobler, L. J., & Arbiza, S. I. (2002). Sources of environmental variation affecting lactation and pre-weaning growth characteristics in Saanen goats. Cuban Journal of Agricultural Science, 36, 117-122.
Valencia, P. M., Dobler, L. J., & Montaldo, V. H. (2005). Genetic trends for milk yield in a flock of Saanen goats in Mexico. Small Ruminant Research, 57, 281-285.
Valencia, P. M., & Montaldo, V. H. (2005). Características de conformación en programas de mejoramiento genético de cabras lecheras. Revista Electrónica Selecciones Veterinarias México. Retrieved from http://132.248.62.51/sv/SV/2005/Febrero /Contenido.html
Weisbeg, S. (1980). Applied linear regression. John Wiley & Sons, New York, USA; 283 pp.
Wiggans, G. R., & Hubbard, S. M. (2001). Genetic evaluation of yield and type traits of dairy goats in the United States. Journal Dairy Science, 84 (E. Suppl.) E69-E73.