MATERIAL AND METHODS
Reagents and materials
All the solutions were prepared with deionized water and chemical reagents used (HNO3 and H2O2) are high-purity (Merck).
Standard solutions of each metal. They are prepared each time the determination by atomic absorption is made, from a stock solution of 1000 mg/L analytical grade (Na cas # 7440-23-5, K cas # 7440-09-7, Ca cas # 7440-70-2 and Mg cas # 7439-95-4 AccuStandard) in 0.2% of HNO3.
Chemical modifiers such as LiCl and LaCL3 to 0.2% are used, to avoid ionic interference in Na and K, as well as chemical interference in Ca and Mg, respectively.
Certified reference material of urine NIST 2670b. For this study a reference standard of human serum was not had, for that reason it was replaced by a standard certificate of urine, which despite of having a different matrix, by the large number of proteins present in the blood serum with respect to the urine, the process of digestion by the wet process eliminates the interference of matrix in both cases (serum and urine).
Decontamination of materials. All the glassware (serological pipettes and volumetric imaging, beakers, flasks of aforacion), tiptoe to micropipettes and plastic containers were washed with liquid detergent rinsed with plenty of deionized water, subsequently they were subjected to a solution of HNO3 to 30% for three days to finally be rinsed with plenty of deionized water, dried at room temperature in an area free of dust and stored in plastic containers with tight-fitting lid until use (Van Loon, 1985; NMX-AA-115-SCFI-2001).
Equipment
All mass measurements for the preparation of different solutions were conducted in analytical balance brand Vibra 220/0.0001 g (Max/d) model AFR220E. The calibration of the analytical balance was carried out using standard masses calibrated by the National Metrology Center (NMC). Calibration of the volumetric material was carried out by the gravimetric method (Christian, Dasgupta & Schung, 2014; Ruiz-Morer, 2006).
The quantification of the electrolytes (Na, K, Ca and Mg) was conducted in a team of Atomic Absorption Spectroscopy Perkin Elmer 3100 model with spray flame (Perkin, 1986). The instrumental operating conditions are summarized in table 1.
Tabla 1.
Instrumental parameters used in the analysis of serum electrolytes (Na, K, Ca, Mg),
using the atomic absorption technique by flame.
|
|
Parameter
|
Electrolyte
|
|
Na
|
K
|
Ca
|
Mg
|
|
α (nm)
|
589.6
|
766.5
|
422.7
|
285.2
|
|
Slit (nm)
|
0.7
|
0.7
|
0.7
|
0.7
|
|
Lamp
|
Hollow cathode
|
Hollow cathode
|
Hollow cathode
|
Hollow cathode
|
|
Type of flame
|
air-acetylene
|
air-acetylene
|
air-acetylene
|
air-acetylene
|
|
Elimination of interferences
|
LiCl 0.2%
|
LiCl 0.2%
|
LaCl30.1%
|
LaCl30.1%
|
|
Sensitivity
|
Standard
0.8 μg/mL
Abs = 0.23
|
Sandard
2 μg/mL
Abs = 0.22
|
Standard
4 μg/mL
Abs = 0.20
|
Standard
0.3 μg/mL
Abs = 0.19
|
Source: Perkin, 1986.
Abrir
Sampling. The collection of blood sample was carried out by venipuncture using the technique of the tourniquet. Blood was collected in a test tube without anticoagulant, and was subsequently left at room temperature for the coagulation to happen and was immediately proceeded to centrifuge at 2500 rpm for 5 min to obtain the blood serum (Henry, 2011). The amount of samples obtained was from 60 patients clinically healthy between 15 and 50 years, regardless of the sex of the patient. The serum obtained was mixed and it was subsequently split up in 10 ml aliquots that were frozen and stored at -4 ºC.
Digestion procedure by the wet process
For decomposition of the serum samples, three replicas of 5 ml each were prepared. Later, 10 ml of concentrated HNO3 was added (Suprapur Merck). The samples were warmed in heating plates until reaching a temperature of 120 °C to obtain a final volume of 5 ml; subsequently 5 ml of H2O2 to 30% were added, and finally 3 ml of concentrated HNO3 were added concentrated to the total mineralization of the serum. The resulting acid extract was placed in a flask of aforacion of 100 ml and was diluted to volume with deionized water (Gómez-Álvarez, 2004; NMX-AA-051-SCFI-2001). Digestion by wet process was applied to both blood serum samples as the reference standard certificate, as well as a blank of deionized water and everything was carried out in triplicate. For the determination of Na and K a solution of LiCl to 0.2% was used, while for Ca and Mg a solution of LaCl3 to 0.2% was used. This applies to the samples, calibration standards and standard certifícate.
Validation of the method
The analytical conditions for the quantification of each electrolyte were carried out from the standard solutions for each element, as well as with the samples of human blood serum and a reference standard certificate digested by the wet process. Quality parameters evaluated for the validation of the analytical method are the conventionally used for these cases (CENAM-EMA, 2008a; ISO 15189, 2003).
Linearity. It was determined on the basis of the realization of three calibration curves with five different concentrations of standard solutions of acid within the range of linearity of each one of the electrolytes: 0.25 mg/L, 0.50 mg/L, 1.0 mg/L, 2.0 mg/L and 5.0 mg/L for Na and Mg; and 0.5 mg/L, 1.0 mg/L, 2.0 mg/L, 5.0 mg/L and 10.0 mg/L for K and Ca. Linearity was evaluated through the calculation of the Pearson (R2) coefficient of correlation through the analysis of residues with the coefficient of determination (R). And was corroborated through F-statistic with a 5% level of significance (α = 0.05).
Accuracy. To evaluate the accuracy, individual standards of work were prepared to concentrations of 1.0 mg/L for Na and Mg. For K and Ca the used concentration was of 2.0 mg/L, which represent the average value of the concentrations used for the calibration curves. All the determinations were made by increased sevenfold. To simulate the conditions in which the electrolytes are found in human blood serum a mixed standard at concentrations of 3000 mg/L, 200 mg/L mg/L, 100 mg/L and 25 mg/L was prepared for Na, K, Ca and Mg, respectively. All the determinations were made by increased sevenfold. The accuracy was assessed by the rate of recovery and it was corroborated using Student’s t-test with a 5% level of significance (α = 0.05).
Precision. To determine the precision, the same analytical conditions that were used in the analysis of the accuracy were used for individual standards and mixed. Accuracy was evaluated by the percentage of the coefficient of variation, as well as under repeatability conditions. To estimate the repeatability solutions of work that was mentioned before were prepared by fivefold and analyzed every three weeks. Determination of concentrations of individual standards and mixed was done every three weeks, for sixteen weeks (six determinations for a total of thirty). Assessment of the repeatability was carried out through an analysis of variance using Pearson's Chi-square (Xi2) statistical test with a 5% level of significance (α = 0.05).
Limit of detection and limit of quantification. The solutions prepared for estimating the linearity, were used to evaluate the limit of detection (LD) and limit of quantification (LQ). Based on the data on the concentrations of the standards and absorbance readings, the Pearson correlation coefficient (R2), the slope, the ordered, and the standard deviation were calculated. With these data the LD as the concentration of the analyte, which provides a signal equal to the signal from the blank plus three times the standard deviation of the blank, was also calculated. The LQ was determined as the concentration of the analyte, which provides a signal equal to the signal from the blank plus ten times the standard deviation of the blank.
Accuracy from a reference standard certificate. A urine reference standard certificate was used (National Institute Standard Technology [NIST] 2670a). This simulates the conditions of a reference standard certificate of human serum and contains metals Na, K, Ca and Mg. This standard reference was prepared under the instructions specified in the certificate, which stipulate that the standard is dried and should be resuspended with 20 ml of deionized water. The standard was digested by the wet process as explained in the digestion procedure for the samples of human blood serum. The determinations for each metal were carried out in triplicate, and the accuracy was evaluated through the percentage of recovery.
Implementation of the validated method
The validated method was applied to the quantification of Na, K, Ca and Mg, from human blood serum. Three replicas of 5 ml were taken of blood serum and in triplicate and were digested by wet process. The resulting acid extract was placed in a flask of graduated Pyrex of 100 mL and was diluted to volume with deionized water. For the determination of metals of interest a solution of LiCl was used to 0.2% for Na and K, while for Ca and Mg a solution of LaCl3 was used to 0.2%.
RESULTS AND DISCUSSION
Validation of the method
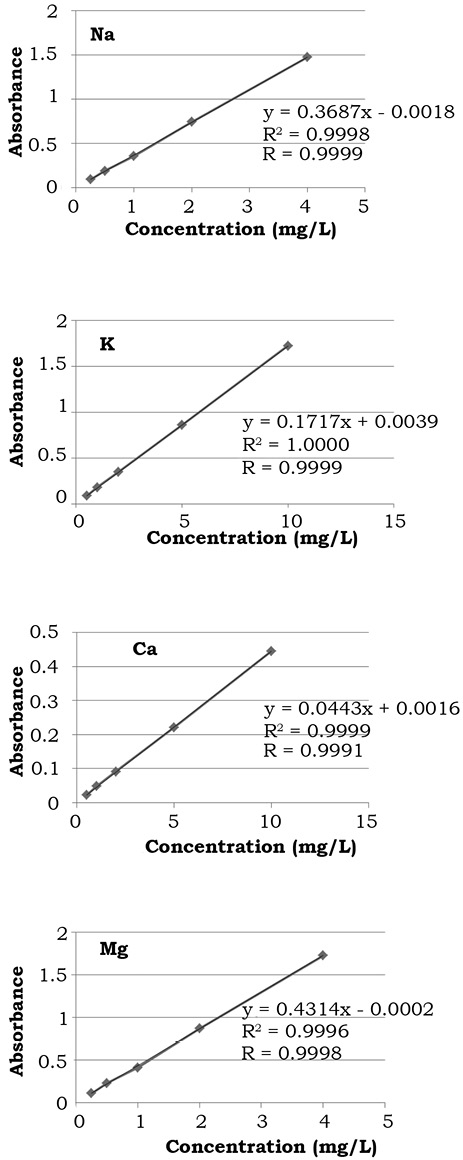
Linearity. The Pearson coefficient of correlation (R2) indicates how good is the degree of association between two variables (Harvey, 2011). In this study, while the coefficient of determination (R) is an indication of an acceptable fit to the data to the regression line, that indicates how good is the linear regression model to represent two variables; which in this case are absorbance against concentration (Harvey, 2011). Results obtained are shown in figure 1. For the four metals evaluated the values are very close to 1.00, it is therefore considered that the linearity is acceptable, since a value of R2 or R > 0.995 is regarded as acceptable by official institutions such as the International Union of Pure and Applied Chemistry (IUPAC, 1999), the National Metrology Center (México), and the Mexican Accreditation Entity (CENAM-EMA, 2008b).
|
| |
 |
| |
Figure 1. Fitted regression curves of Na, K, Ca and Mg to assess linearity by correlation coefficient (R2) and the coefficient of determination (R).
Source: Authors own elaboration. |
|
Figure 1. Fitted regression curves of Na, K, Ca and Mg to assess linearity by correlation coefficient (R2) and the coefficient of determination (R).
Source: Authors own elaboration. Close |
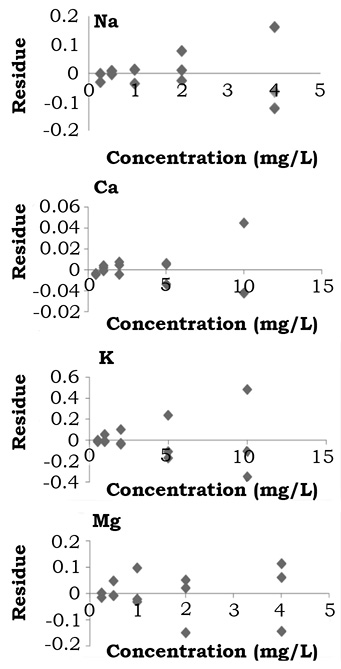
In this study an analysis of the residue (or residual) was also conducted. The residue is the difference between the prognostic value and the observed value. The prognostic value is obtained from the linear regression associated to the equation of the straight with values for x and y. By replacing the value for x the predicted value is gotten, which is not necessarily equal to the observed value. In this sense, it must be ensured that the graphic behavior of the waste does not show any trend and the waste must have a random distribution (Blair & Taylor, 2007; Serrat-Orús et al., 2011). In this way, the results obtained show that the linearity continues to be robust, as the analysis of the residues presents no trend and show a random distribution (figure 2).
|
| |
 |
| |
Figure 2. Graphic behavior for residue analysis to asses Linearity of Na, K, Ca and Mg.
Source: Authors own elaboration. |
|
Figure 2. Graphic behavior for residue analysis to asses Linearity of Na, K, Ca and Mg.
Source: Authors own elaboration. Close |
To corroborate Linearity numerically, statistical analysis was performed of F-test or analysis of variance of the regression, whose principle is to break down the variance between the existing experimental signals and the predicted values in two contributions. One of them is the variance of the experimental error and the other is due to a failure in the variance of regression adjustment. As can be seen in table 6 all the values obtained for F calculated, were lower than the F-values of tables with a significance level of 5% (α = 0.05) (data not shown), so also for this statistical test, the Linearity for the four metals analyzed is accepted (Miller & Miller, 2010).
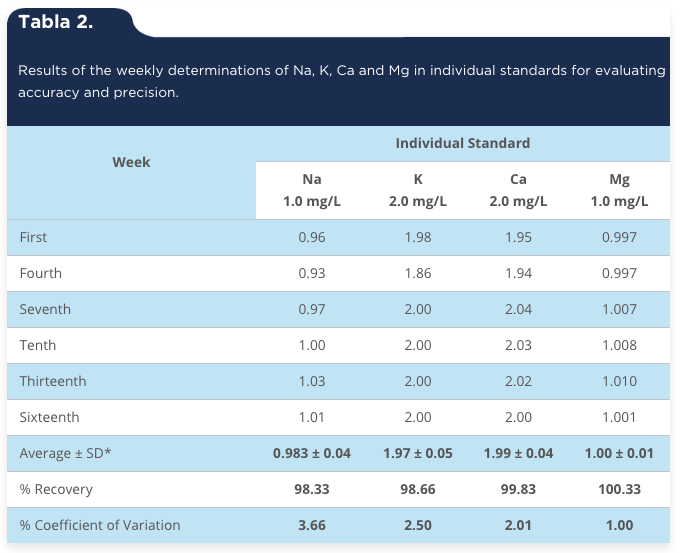
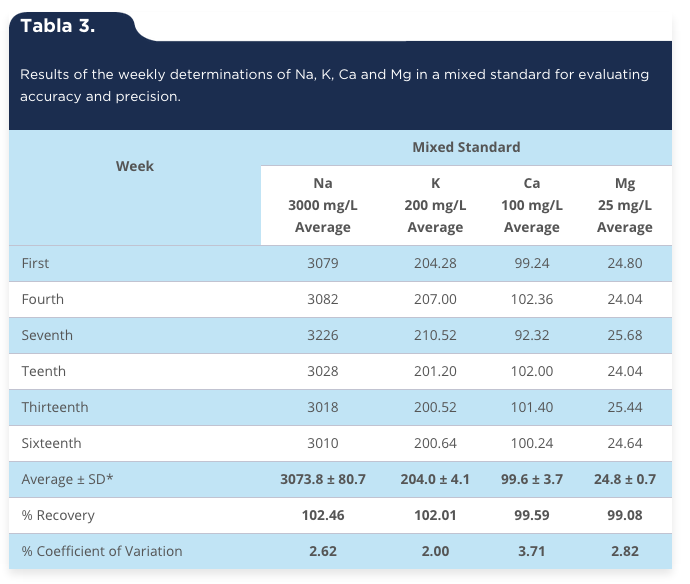
Accuracy. One of quality criteria that has great relevance in the validation of an analytical method is the accuracy. This parameter reflects, clearly the degree of concordance between real value (measured) and a theoretical value (true) and generally it is based through the percentage of recovery (or regained) (Christian et al., 2014; Reyes-Castañeda, 2004; Skoog, West, Holler & Crouch, 2013). The results obtained of the individual standards of Na, K, Ca and Mg, indicate that the accuracy obtained is acceptable (table 2). In general terms, the recovery rates for the four metals fluctuated in a range of 98.33% to 100.30% with an overall average of 99.28% recovery. That is considered acceptable because the IUPAC (1999) established that the percentages of recovery must be between 85% and 115% (100% ± 15%). To corroborate the accuracy of the method used in individual standards, they undertook the Student’s t-test with a significance level of 5% (α = 0.05). All the values obtained for t are lower than the t-value of tables (2.447) and fall within the range of acceptance (-2.447 to 2,447). Consequently, the results are considered acceptable. These recovery percentages obtained are similar to the results found for Zn (Coskun et al., 2008; Ghasemi & Zahediasl, 2012; Rivas & Fernández, 2006), and with the results obtained for several metals in serum of dog (Tomza-Marciniak, Pilarczyk-Malgorrata, Ligocki & Gaik, 2012), as well as the results obtained for K, Mg, Ca and other trace elements in human serum (Dlugaszek, Szopa, Rzeszotarsky & Karkowiak, 2008; Suárez, Arévalo, Linares, Ustáriz & Hernández, 2009; Zhang et al., 2013). It was similarly proceeded to calculate the accuracy with the standard mixed (Na 3000 mg/L, K 200 mg/L, Ca 100 mg/L, and Mg 25 mg/L; table 3). The range for the percentage of recovery was from 99.08% to 102.46%, with an overall average of 100.78%, which is considered acceptable as they are within the recommended range (ISO 5725-2, 1994; CENAM-EMA, 2008a). To corroborate the accuracy of the method used in a standard mixed, the Student’s t-test with a significance level of 5% (α = 0.05). All the values obtained for t are lower than the t-value of tables (2.447) and fall within the range of acceptance (-2.447 to 2.447), so the results are considered acceptable.
Precision. Is a measure of the dispersion of the data around a central value or the degree of concordance between replicated measurements of the same amount, and can be expressed as range, standard deviation, percentage of coefficient of variation or the variance (Skoog & Holler, 2006; Miller & Miller, 2010). In this work, the accuracy was assessed by calculating the percentage of the coefficient of variation (%CV). It can be seen in table 2 that the precision fluctuated between 1.00 and 3.66 with an overall average of 2.29 (%CV) for the individual standards; whereas, in table 3 it can be seen that for the standard mixed the range is between 2.00 and 3.71 with an overall average of 2.78 (%CV). In both cases, these values are considered acceptable as for instrumental methods is considered acceptable a %CV less than 10% (IUPAC, 1999).
Tabla 2.
Results of the weekly determinations of Na, K, Ca and Mg in individual standards for evaluating accuracy and precision.
|
|
Week
|
Individual Standard
|
|
Na
1.0 mg/L
|
K
2.0 mg/L
|
Ca
2.0 mg/L
|
Mg
1.0 mg/L
|
|
First
|
0.96
|
1.98
|
1.95
|
0.997
|
|
Fourth
|
0.93
|
1.86
|
1.94
|
0.997
|
|
Seventh
|
0.97
|
2.00
|
2.04
|
1.007
|
|
Tenth
|
1.00
|
2.00
|
2.03
|
1.008
|
|
Thirteenth
|
1.03
|
2.00
|
2.02
|
1.010
|
|
Sixteenth
|
1.01
|
2.00
|
2.00
|
1.001
|
|
Average ± SD*
|
0.983 ± 0.04
|
1.97 ± 0.05
|
1.99 ± 0.04
|
1.00 ± 0.01
|
|
% Recovery
|
98.33
|
98.66
|
99.83
|
100.33
|
|
% Coefficient of Variation
|
3.66
|
2.50
|
2.01
|
1.00
|
* = Standard deviation.
Source: Authors own elaboration.
Abrir
 |
* = Standard deviation.
Source: Authors own elaboration. Close |
Tabla 3.
Results of the weekly determinations of Na, K, Ca and Mg in a mixed standard for evaluating accuracy and precision.
|
|
Week
|
Mixed Standard
|
|
Na
3000 mg/L
Average
|
K
200 mg/L
Average
|
Ca
100 mg/L
Average
|
Mg
25 mg/L
Average
|
|
First
|
3079
|
204.28
|
99.24
|
24.80
|
|
Fourth
|
3082
|
207.00
|
102.36
|
24.04
|
|
Seventh
|
3226
|
210.52
|
92.32
|
25.68
|
|
Teenth
|
3028
|
201.20
|
102.00
|
24.04
|
|
Thirteenth
|
3018
|
200.52
|
101.40
|
25.44
|
|
Sixteenth
|
3010
|
200.64
|
100.24
|
24.64
|
|
Average ± SD*
|
3073.8 ± 80.7
|
204.0 ± 4.1
|
99.6 ± 3.7
|
24.8 ± 0.7
|
|
% Recovery
|
102.46
|
102.01
|
99.59
|
99.08
|
|
% Coefficient of Variation
|
2.62
|
2.00
|
3.71
|
2.82
|
* = Standard deviation.
Source: Authors own elaboration.
Abrir
 |
* = Standard deviation.
Source: Authors own elaboration. Close |
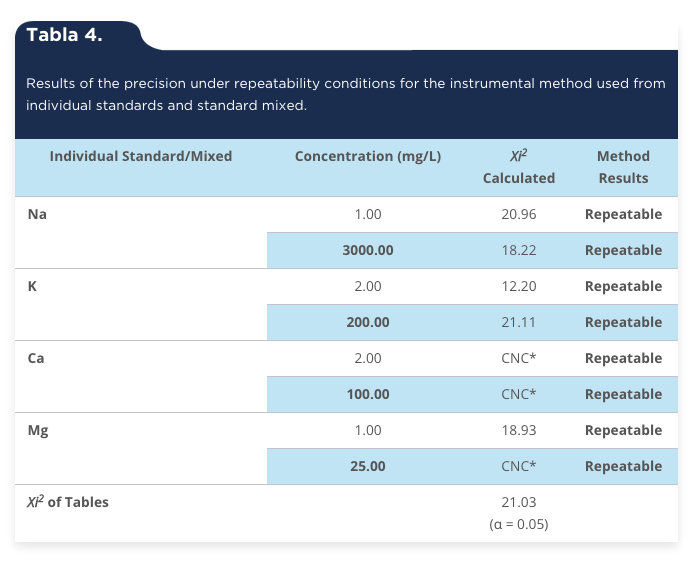
The precision evaluated under repeatability conditions is the degree of concordance between the results of successive measurements of the same measurand carried out entirely under the same conditions of measurement (ISO 5725-2, 1994; CENAM-EMA, 2008a; Olmedo et al., 2010). The repeatability conditions include: the same procedure, the same analyst/observer, the same location, the same instrument and the same conditions of measurement. By successive measurements it is referred as those repeated measurements within a short period of time (Álvarez et al., 2003; Canalías, 2003). In relation to the results obtained from repeatability for the individual standards, it can be seen that the method is acceptable for the four standards that contain individually to each one of the metals (Na, K, Ca and Mg). According to the analysis of variance using the Xi2 test (table 4), considering that the value of Xi2 calculated is less than the value of tables (21.03) with a significance level of 5% (α = 0.05) for the four metals. The foregoing indicates that the repeatability obtained in the analysis of metals by part of the analyst was acceptable in the set time which was 16 weeks. With respect to the standard Ca of 2 mg/L, it was noted that the results were identical (2.00 ± 0.00) by what the variation cannot be calculated, that is to say the results were accurate and reliable. In addition the results obtained in the standard mixed were similar and consistent as the case of the individual standards. In the present work it is important to note that only a standard mixed that contains 3000 mg/L, 200 mg/L, 100 mg/L and 25 mg/L Na, K, Ca and Mg, respectively was evaluated, the results indicate that the method is repeatable (table 4). It can also be seen that in the standard for Ca of 25 mg/L (25.00 ± 0.00 mg/L and 10 ± 0.00 mg/L (10.00), the Xi2cal could not be calculated (CNC); which means that there is no variance in the results and therefore there is a high precision and accuracy to be the identical data to the concentration of the standard involved. Validation of the accuracy through the repeatability of the measurement procedures is also a requirement of international standards that are used to implement a quality management system in the clinical laboratories (Thienpont, van Nuwenborg, Reinauer & Stockl, 1996; Thompson, Ellison & Wood, 2002). Therefore, repeatability is considered acceptable on the basis of the results obtained.
Tabla 4.
Results of the precision under repeatability conditions for the instrumental method used from individual standards and standard mixed.
|
|
Individual Standard/Mixed
|
Concentration (mg/L)
|
Xi2
Calculated
|
Method
Results
|
|
Na
|
1.00
|
20.96
|
Repeatable
|
|
3000.00
|
18.22
|
Repeatable
|
|
K
|
2.00
|
12.20
|
Repeatable
|
|
200.00
|
21.11
|
Repeatable
|
|
Ca
|
2.00
|
CNC*
|
Repeatable
|
|
100.00
|
CNC*
|
Repeatable
|
|
Mg
|
1.00
|
18.93
|
Repeatable
|
|
25.00
|
CNC*
|
Repeatable
|
|
Xi2 of Tables
|
|
21.03
(α = 0.05)
|
|
*CNC = Can Not calculate.
Source: Authors own elaboration.
Abrir
 |
*CNC = Can Not calculate.
Source: Authors own elaboration. Close |
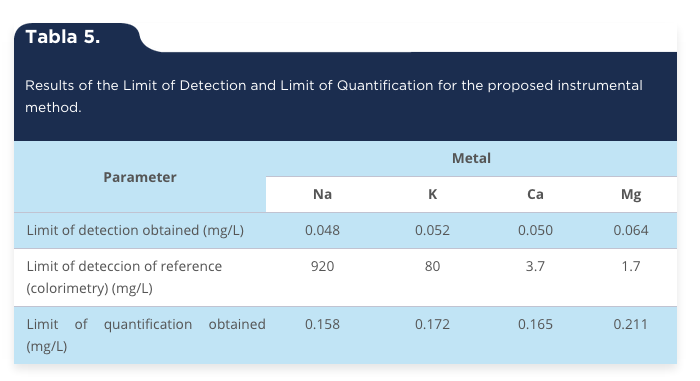
Limit of Detection (LD) and limit of quantification (LQ). The results obtained for LD and LQ can be seen in table 5. LD for each of the metals fluctuates around 0.050 mg/L and they are very similar to the values for Ca (0.03 mg/L) and Mg (0.03 mg/L) in human serum, reported in other research (Acosta-García, Páez, Barón, Velásquez & Solano, 2009; Caudill & Boone, 1986). The LQ obtained for the four metals can be viewed that are consistent and similar to those reported by other investigators (Alvarado & Peñaloza, 2006) and are regarded as acceptable for the instrumentation used. Difference between limits of detection by atomic absorption and colorimetric methods corresponds to 19166, 1538, 74 and 26 times for Na, K, Ca and Mg, respectively. Consequently, is more than obvious the ability to detect the LD and LQ of an analyte using atomic absorption spectroscopy.
Tabla 5.
Results of the Limit of Detection and Limit of Quantification for the proposed instrumental method.
|
|
Parameter
|
Metal
|
|
Na
|
K
|
Ca
|
Mg
|
|
Limit of detection obtained (mg/L)
|
0.048
|
0.052
|
0.050
|
0.064
|
|
Limit of deteccion of reference
(colorimetry) (mg/L)
|
920
|
80
|
3.7
|
1.7
|
|
Limit of quantification obtained (mg/L)
|
0.158
|
0.172
|
0.165
|
0.211
|
Source: Authors own elaboration.
Abrir
 |
Source: Authors own elaboration. Close |
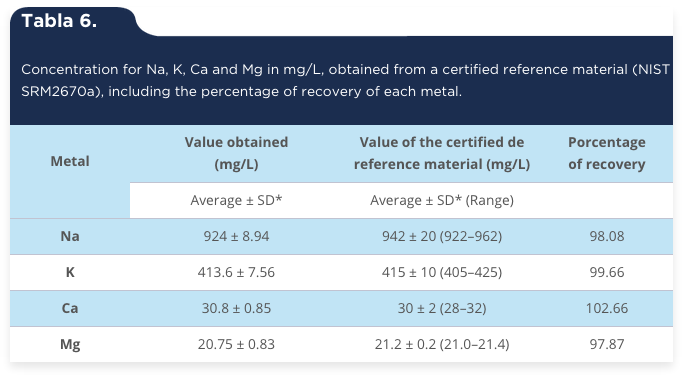
Accuracy from a reference standard certificate. A certified reference material (CRM) is a standard reference accompanied by a certificate whose value of the property is certificated by a procedure that establishes its traceability to an exact realization of the unit in which the property values are expressed and for which each value certificate is accompanied by a uncertainty to a level of reliability indicated (Thompson et al., 2002). As can be seen in table 6, the concentration obtained for each metal is within the range specified in the reference standard certificate; while the percentage of recovery was acceptable, as for Na was 98.08, for K was 99.66, for Ca was 102.66 and for Mg was 97.87, respectively. In this regard, it is important to note that for the IUPAC (1999) the percentage of recovery that is recommended for certified reference materials is 100% ± 5% with a range of 95% to 105% recovery, by what is considered acceptable accuracy obtained by using the percentage of recovery for this work.
Tabla 6.
Concentration for Na, K, Ca and Mg in mg/L, obtained from a certified reference material (NIST SRM2670a), including the percentage of recovery of each metal.
|
|
Metal
|
Value obtained
(mg/L)
|
Value of the certified de reference material (mg/L)
|
Porcentage
of recovery
|
|
Average ± SD*
|
Average ± SD* (Range)
|
|
|
Na
|
924 ± 8.94
|
942 ± 20 (922–962)
|
98.08
|
|
K
|
413.6 ± 7.56
|
415 ± 10 (405–425)
|
99.66
|
|
Ca
|
30.8 ± 0.85
|
30 ± 2 (28–32)
|
102.66
|
|
Mg
|
20.75 ± 0.83
|
21.2 ± 0.2 (21.0–21.4)
|
97.87
|
* = Standard deviation.
Source: Authors own elaboration.
Abrir
 |
* = Standard deviation.
Source: Authors own elaboration. Close |
Implementation of the validated method. With the purpose to verify that the test method is standardized and be able to evaluate its applicability in blood biological samples, a composite (pool) of human blood serum was used. This pool was previously subjected to wet digestion with concentrated nitric acid and hydrogen peroxide. From the composite three replicas were obtained and each one of them was analyzed by triplicate. The results obtained are shown in table 7. Obtained results fall within the range of reference values reported in the literature for each of the metals evaluated. It should be noted that these reference values are considered as 'normal' and are obtained from colorimetric methods. The results obtained for Na, K, Ca and Mg serum; coincide with the results reported by other researchers for a Spanish population (Díaz-Romero et al., 2002). Likewise, the results obtained for Ca and Mg also coincide with what is reported in a study conducted in a population of Venezuela (Acosta-García et al., 2009). Similar results to those obtained in this study, for Ca and Mg were found in an elderly population in Leon, Spain (Villarino-Rodríguez, García-Linares, García-Fernández & García-Arias, 2003). What are important about these determinations are the pathological states, where the values are below normal and colorimetric methods have a low detection limit, compared against the method of Atomic Absorption Spectroscopy (AAS) that has a high limit of detection. It is important to note that the protocols of Spinreact (2004) for the quantification of metals in blood serum, using colorimetric methods, consider only a broad range of values of reference and they include men, women, children and/or the elderly, meaning that the age or sex of the patient do not matter. In these protocols it is noted that the reference values are indicative and it is recommended that each laboratory establishes its own reference values. In contrast, the Randox protocols (1993) set ranges for these values by age and sex. If reference values are analyzed, no differences are appreciated, at least for Na, K, Ca and Mg (table 7).
Tabla 7.
Concentration obtained for Na, K, Ca and Mg (mg/L) from human blood serum.
|
|
Metal
|
Value Obtained (mg/L)
|
Value of reference (mg/L)
|
|
Na
|
3422 + 120 (3302–3542)
|
3130–3360
|
|
K
|
175 + 7 (168–182)
|
137–199
|
|
Ca
|
96 + 14 (82–110)
|
82–102
|
|
Mg
|
20 + 0 (20)
|
17–27
|
Source: Randox, 1993.
Abrir
It is noteworthy that at present the vast majority of private medical analysis laboratories and hospitals (public and private), are focused on the quantification of serum electrolytes (Na, K, Ca and Mg) for diagnosis. This is done through potentiometric technique, for example selective ion (Na and K); or by manual or automated colorimetric techniques, primarily because they have the equipment to do so because they are practical and fast. However, these techniques are of low sensitivity and low specificity. In addition, their detection limit is high and have a lot of interference, especially in certain disease states. However, these are not the only constraints of both methods, some are not validated and do not meet current regulations.
Currently, in the Mexican Official Norm there is a reference method for evaluating the concentration of Na, K, Ca and Mg in biological fluids. In this regard, the importance of this study was to validate a method of analysis of Na, K, Ca and Mg by AAS in human blood serum that allows or may be used as the reference method. While the method for quantifying serum electrolytes by atomic absorption spectroscopy is not new, what is relevant to this study is the methodology validation process, which had not been done before.
Moreover, it is true that having an atomic absorption equipment for analyzing electrolytes is expensive compared to traditional techniques, but offers greater speed and reliability. These instruments would be very useful in hospitals (private and public) that handle large numbers of patients who demand the analysis of electrolytes. In this way the investment is not too expensive.
We must also clarify that it is not intended that clinical laboratories routinely change their potentiometry equipment or ion selective their spectrophotometers. What is intended to emphasize is the need to validate their analytical methods, according to what sets the current regulations.
Finally, it is important to use the nomenclature and the harmonization of concepts in process validation in clinical chemistry to have confidence in the analytical methods used, as well to the results obtanined; or work in the validation of new automated systems (González & Herrador, 2007; Oosterhuis, Ulenkate & Goldschmidt, 2000; Theodorsson, 2012).
We are grateful for the support provided by the Department of Chemical Biological Sciences and the Department of Chemical Engineering and Metallurgy of the University of Sonora for the realization of the present research project. We also like to thank the participation of Sachenka García Burgueño for the revision and correction of the drafting of the writing in English.