ABSTRACT
C6 glioma cells have been proposed as a cell model system to study regulation of endogenously-expressed glycine transporter 1 (GlyT1). However, there are no reports demonstrating expression of glycine transporter 2 (GlyT2) in this cell line. To explore this possibility, immunoprecipitation, western blotting, confocal microscopy, as well as glycine uptake assays using selective inhibitors to GlyT1 or GlyT2 were employed. Glycine uptake assays using a selective inhibitor against GlyT2 provided evidence that this transporter could also be expressed in this cell line. Immunoprecipitation, immunoblotting, and confocal microscopic analysis also showed presence of both GlyT1 and GlyT2 in this cell line. Taken together, results provide evidence that in addition to GlyT1, GlyT2 is also endogenously expressed in C6 glioma cells. Results presented here will help researchers to carefully evaluate use of this cell line in studies involving GlyT1.
RESUMEN
Se ha propuesto el uso de las células C6 de glioma como un modelo celular para el estudio de la regulación del transportador de glicina 1 (GlyT1, por sus siglas en inglés) expresado de forma endógena. Sin embargo, no existen reportes que demuestren la expresión del transportador de glicina 2 (GlyT2, por sus siglas en inglés) en esta línea celular. Para explorar esta posibilidad, se utilizaron diversas técnicas experimentales, como inmunoprecipitación, Western blot, microscopía confocal y ensayos de transporte de glicina, empleando inhibidores selectivos. Los ensayos de transporte de glicina utilizando inhibidores selectivos proporcionaron evidencia de la expresión de GlyT2 en esta línea celular. Los análisis realizados utilizando inmunoblots y microscopía confocal también demostraron la presencia de GlyT1 y GlyT2. Nuestros resultados proporcionan evidencia de que, además de GlyT1, las células C6 de glioma también expresan el GlyT2, indicando que se debe evaluar cuidadosamente el uso de esta línea celular para el estudio de GlyT1.
INTRODUCTION
Glycine is an amino acid that functions as a neurotransmitter and is involved in excitatory and inhibitory neurotransmission (Legendre, 2001). Under normal conditions, glycinergic synapses are terminated when glycine concentration reaches lower levels than those required by glycine receptor and by N-methyl-D-aspartate (NMDA) receptor at inhibitory and excitatory synapses, respectively (Aprison, Shank & Davidoff, 1969; Betz, Gomeza, Armsen, Scholze & Eulenburg, 2006; Curtis, Duggan & Johnston, 1971; Davidoff, Aprison & Werman, 1969; Johnson & Ascher, 1987). Extracellular concentration of free glycine is tightly modulated by high-affinity glycine transporters (GlyTs) which belong to solute carrier 6 (SCL6) Na+/Cl–- dependent family of neurotransporters (Aragón & López-Corcuera, 2006). The SCL6 family is a very prominent group of pharmacological targets which includes transporters for neurotransmitters Gama-aminobutyric acid (GABA), serotonin, dopamine, norepinephrine, proline, and orphan (Torres, Gainetdinov & Caron, 2003). However, only two high-affinity glycine transporters are known, GlyT1 and GlyT2 (Aragón & Lopez-Corcuera, 2003). Pharmacologically, both GlyTs are different, because selective inhibitors for them such as sarcosine, XLA-5407, and XLA-1393 only inhibit one of them, either GlyT1 or GlyT2, but not both (Atkinson et al., 2001; Aubrey & Vandenverg, 2001). In addition, cellular distribution and molar stoichiometry of transport are different for each one of the GlyTs (Zafra et al., 1995; Zafra, Aragón & Giménez, 1997). Structurally, both share a similar topology with 12 transmembrane domains that span the plasma membrane, cytoplasmic N- and C-terminus, and a large secondary external loop with multiple N-glycosylation sites (Olivares, Aragón, Giménez & Zafra, 1997; Yamashita, Singh, Kawate, Jin & Gouaux, 2005). Since expression of GlyTs is enriched in the central nervous system, use of a cell line with endogenous expression of GlyTs has been very limited, with most studies relying on the use of cell lines with stable exogenous expression of transporters. Although GlyT2 expression has been recently found in primary cultures of rat astrocytes (Aroeira, Sebastião & Valente, 2013). In this regard, C6 glioma cell line has been reported to have endogenous expression of GlyT1 and has been used as a model to study GlyT1 function (Gomeza, Zafra, Olivares, Giménez & Aragón, 1995; Pearlman, Aubrey & Vandenberg, 2003). Moreover, it has been found that PKCα is responsible for activity regulation of endogenously expressed GlyT1 in C6 glioma cells (Morioka et al., 2008). Early results obtained by means of pharmacological tools indicated endogenous expression of different glycine transporter systems in C6 glioma cells, but only presence of GlyT1 has been demonstrated so far (Gomeza et al., 1995; Zafra & Giménez, 1989; Zafra, Alcántara, Gomeza, Aragón & Giménez, 1990). Therefore, it is possible that endogenous GlyT1 and GlyT2 may co-exist in C6 glioma cells. Thus, by using a combination of properly controlled biochemical, pharmacological, and microscopy techniques, we aimed to determine if C6 glioma cells possess endogenous expression of GlyT2 in addition to GlyT1. Results indicate that both glycine transporters are present in C6 glioma cells.
MATERIAL AND METHODS
Chemicals and antibodies
Radioisotope [3H]-glycine was purchased from Perkin Elmer Life Scientific (Boston, MA). XLA-5407, XLA-1393, Flag-M2 agarose beads, N-ethylmaleimide, sodium fluoride, phenylmethanesulfonyl fluoride, aprotinin, and leupeptin were from Sigma-Aldrich Co. (St. Louis, MO). Rabbit polyclonal antibody to GlyT1 was kindly donated by Detlev Boison and Dietmar Benke (University of Zurich). Rabbit antibody to GlyT2 was a customized antibody from Dr. Manuel Miranda’s laboratory (University of Texas at El Paso). HRP-conjugated secondary antibodies were from Promega (Madison, WI).
GlyT1 and GlyT2 Plasmids
GlyT1 was kindly donated by Bruno Giros (University of Italy). GlyT1 and GlyT2 were tagged with Flag and 10X-His epitope at the N-termini (FH-GlyT1 and FH-GlyT2) as previously described (Miranda, Wu, Sorkina, Korstjens & Sorkin, 2005). Resulting constructs were cloned into pcDNA 3.1 and Deoxyribonucleic Acid (DNA) sequence was verified by automatic deoxynucleotide sequencing.
Cell culture and stable expression of GlyT1 and GlyT2
Porcine aortic endothelial (PAE) cells were selected to generate stable cell lines, and they were kindly provided by Dr. A. Sorkin (University of Colorado at Denver). PAE cells were grown at 37 ºC and 5% CO2 in Ham’s F-12 medium containing 10% fetal bovine serum (FBS) and 100 µg/ml gentamicin. PAE cells were grown to 50% – 80% confluence and transfected with appropriate plasmids using Effectene, according to manufacturer’s recommendations (Qiagen, Hilden, Germany). PAE cells stably expressing FH-GlyT1 or FH-GlyT2 were selected by growing them in presence of G418 (400 µg/ml). C6 glioma cells (ATCC, Manassas, VA) were grown under the same conditions described for PAE cells but in Ham’s F-12 Kaighn’s modification medium containing 1.25% FBS and 7.5% of horse serum.
Determination of [3H]glycine uptake
Glycine uptake by PAE cell lines (with stable expression of GlyT1 or GlyT2) or by C6 glioma cells was measured as previously described with some modifications (Sato, Adams, Betz & Schloss, 1995). Confluent cells were washed with 0.25 ml of wash buffer containing 10 mM Hepes, pH 7.4, 135 mM NaCl, 2 mM KCl, 1 mM CaCl2, 1 mM MgSO4 and 10 mM glucose. Uptake was started by adding 0.25 ml the buffer described above but containing 4 µCi [3H]glycine /ml and 200 µM glycine. Reaction ran for 10 min at 37 ºC, and it was stopped by washing cells twice with ice-cold wash buffer without glycine. This was followed by extraction of [3H]glycine from cells using 0.2 N of NaOH for 1 h. Finally, glycine uptake was determined by scintillation spectroscopy. Total protein concentration was determined by the Bradford (1976) assay using bovine serum albumin (BSA) as a standard.
Double affinity chromatography purification and Western blotting
PAE cells stably expressing FH-GlyT1 or FH-GlyT2 were grown to confluence in 60 mm culture dishes. Cells were washed twice with Ca2+- and Mg2+- free cold phosphate-buffered saline (CMF-PBS) and lysed in ice-cold-buffer containing 25 mM Hepes, pH 8.0, 100 mM NaCl, 15 mM imidazole, 10% glycerol, 1% triton X-100, 1% sodium deoxycholate, 10 mM N-ethymaleimide, 10 µM phenylmethanesulfonyl fluoride, 10 µg/ml aprotinin, and 10 µg/ml leupeptin. Lysates were cleared by centrifugation at 14 000 xg. FH-GlyT1 and FH-GlyT2 were then purified by double affinity chromatography. First, lysates were incubated with Ni-NTA affinity agarose beads for 1 h and eluted with imidazole. Eluted proteins were then incubated with anti-Flag affinity agarose beads for 4 h and eluted with 100 mM glycine, pH 3.5. Purified proteins were then subjected to 8.0% SDS-PAGE, followed by transfer into a nitrocellulose membrane (Laemmli, 1970; Towbin, Staehelin & Gordon, 1979). Membranes were blocked with 5% non-fat dry milk for 1 h. Presence of GlyT1 and GlyT2 was determined by western blotting using the appropriate primary antibodies followed by incubation with corresponding HRP-conjugated secondary antibodies. For sensitive detection, enhanced chemiluminescence (ECL) technique was used according to manufacturer’s instructions (Pierce Biotechnology, Rockford, IL).
Immunofluorescence staining and confocal microscopy
Cells were grown overnight on glass coverslips until they were sub-confluent and were attached to coverslip. Cells were then washed with CMF-PBS, fixed with freshly prepared 4% paraformaldehyde for 15 min at room temperature, and mildly permeabilized by incubation in CMF-PBS containing 0.1% Triton X-100 and 0.5% BSA at room temperature for 3 min. Then, cells were incubated with primary antibodies in CMF-PBS containing 0.5% BSA at room temperature for 1 h, and subsequently incubated for 30 min with secondary antibody labeled with Alexa 488 (Jackson Laboratories, West-Glove, PA). Both primary and secondary antibody solutions were precleared by centrifugation at 14 000 xg for 20 min. After immunostaining, coverslips were mounted in Mowiol (Calbiochem). Images were captured utilizing a laser-scanning confocal microscope (LSM 700; Zeiss) using the 64X objective and assisted with ZEN 2009 software (Zeiss, New York, NY). High-resolution images were acquired through corresponding filter channel (Alexa 488). Fluorescence intensity was measured in 10 cells by pixel in an area of 5 mm2, using three independent experiments. Final arrangement of all images was accomplished using Adobe Photoshop software.
Statistical Analysis
Statistical and kinetic analyses were performed using Sigma Plot 10 software (Systat Software). Unless otherwise stated, glycine uptake or fluorescence intensity values are represented as the mean ± SE of at least three independent experiments, with statistical significance of p < 0.05 determined by Student's paired t test.
RESULTS
Pharmacological analysis of glycine uptake in C6 glioma cells
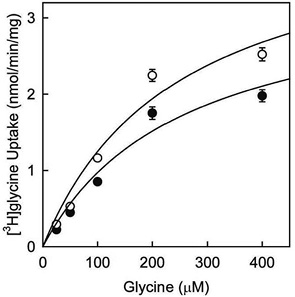
Uptake of [3H]glycine by C6 glioma cells has been previously demonstrated. Furthermore, it was also shown to be downregulated by treatment with phorbol 12-myristate 13-acetate (PMA) (Gomeza et al., 1995). Therefore, it has been made [3H]glycine uptake assay using C6 glioma cells and employing PMA in order to analyze kinetics of the uptake (figure 1). Kinetic enzymatic analysis suggested that glycine uptake may be mediated by a high-affinity glycine transporter because of low Km value (248 ± 113) computed in this analysis. In addition, Km values were very similar after treatment with PMA (Km 255 ± 120; black circles) or vehicle (Km 248 ± 113; white circles). However, Vmax values were shown to be different after PMA treatment (3.4 ± 0.8 in PMA-treated cells and 4.3 ± 1 in cells treated with vehicle). This is consistent with previous reports for other members of SLC6 family of transporters, where downregulation in glycine uptake is due to a reduction in the Vmax, but not in the transporter affinity (Huff, Vaughan, Kuhar & Uhl, 1997).
|
|
|
 |
|
|
Figure 1. Effect of PMA in glycine uptake in C6 glioma cells.
Source: Author’s own elaboration. |
|
Figure 1. Hypothesized models of women’s decision-making capacity
Source: Author’s own elaboration. Close |
Cells were incubated with vehicle (DMSO, white circles) or 1 µM PMA (black circles) for 1 h, followed by determination of glycine uptake. The assay was performed in presence of increasing concentrations of cold glycine (25 µM – 400 µM) in a buffer with a constant concentration of 4 µCi/ml of [3H]glycine at 37 ºC. Kinetic parameters were calculated using the Michaelis-Menten equation and Sigma Plot 10. Values represent mean of 4 independent determinations ± SE (Vargas-Medrano, Castrejón-Téllez, Plenge, Ramírez & Miranda, 2011).
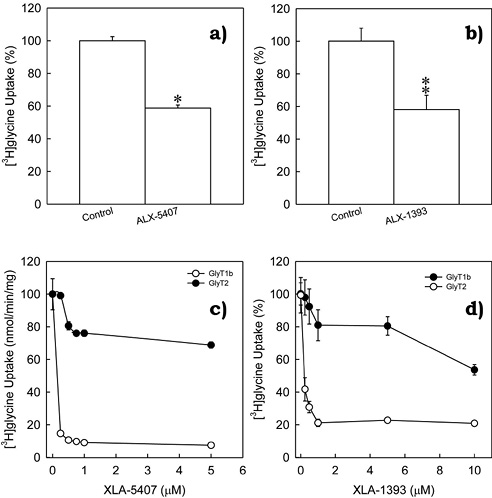
Given data provided by kinetic analysis, and since GlyT1 has already been found to be expressed in C6 glioma cells, we hypothesized that GlyT2 may also be found and expressed in this cell line. In order to verify this hypothesis, were performed a series of glycine uptake assays using C6 glioma cells in presence of selective inhibitors to GlyT1 or GlyT2 respectively. XLA-5407 (0.25 µM), a selective inhibitor to GlyT1, inhibited ~40% of the total glycine uptake (figure 2a, *p < 0.001). Alternatively, GlyT2 inhibitor XLA-1393 (0.75 µM) also inhibited ~40% of total glycine uptake (figure 2b, **p = 0.003). This data strongly suggested presence of two different high-affinity glycine transporters in C6 glioma cells. Selective inhibitors to GlyT1 or GlyT2 were previously described using other models (Atkinson et al., 2001; Aubrey & Vandenberg, 2001), and therefore, validation for this model became necessary. In order to determine tested inhibitors selectivity (XLA-5407 and XLA-1393), were performed dose-response curves testing XLA-5407 and XLA-1393 inhibitors in PAE cells stably expressing GlyT1 and GlyT2. Not surprisingly, both compounds were selective but at a different concentration (figures 2c and 2d). In PAE cells with stable expression of GlyT1, XLA-5407 inhibited ~90% of total glycine uptake at 0.25 µM. This concentration did not affect glycine uptake mediated by GlyT2 (figure 2c). Moreover, 1 µM of XLA-1393 inhibited ~80% of glycine uptake mediated by GlyT2 but did not affect GlyT1 activity (figure 2d). With this analysis, we were able to determine concentrations for a selective inhibition of GlyT1 or GlyT2, but not both.
|
|
|
 |
|
|
Figure 2. Inhibition of glycine uptake in C6 glioma cells by selective inhibitors to GlyT1 or GlyT2.
Source: Author’s own elaboration. |
|
Figure 2. Inhibition of glycine uptake in C6 glioma cells by selective inhibitors to GlyT1 or GlyT2.
Source: Author’s own elaboration. Close |
Glycine uptake from untreated cells was normalized to 100% of glycine uptake and selective inhibitors (a) 0.25 µM ALX-5407 (inhibitor to GlyT1) or (b) 0.75 µM ALX-1393 (inhibitor to GlyT2) significantly inhibited glycine uptake mediated by C6 glioma cells. *p = < 0.001, **p = 0.003 compared to control (untreated cells). Bars represent the mean ± SE, n = 8. GlyT1 or GlyT2 selective inhibitors were further validated by performing dose-response curves with ALX-5407 (c) or ALX-1393 (d) using stable cell lines expressing GlyT1 or GlyT2. Point values represent mean ± SE, n = 4. (Vargas-Medrano et al., 2011).
Immunoprecipitation and immunoblotting analysis of GlyTs in C6 glioma cells
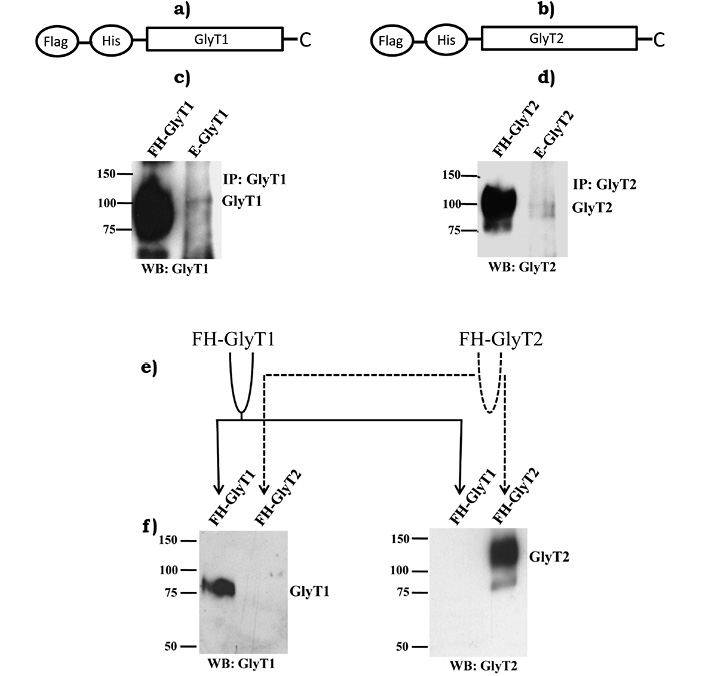
Pharmacological analysis indicated endogenous expression of both GlyT1 and GlyT2 in C6 glioma cells. In order to support our initial hypothesis and pharmacological experiments, were conducted immunoprecipitation and immunoblotting analysis using selective antibodies to GlyT1 or GlyT2. Confluent C6 glioma cells were lysed and endogenous GlyTs were immunoprecipitated using selective antibodies. FH-tagged GlyT1 and FH-GlyT2 (figures 3a and 3b) purified from PAE cells with stable expression of transporters served as positive controls. As hypothesized, bands at about ~100 kDa were detected in lysates from C6 glioma cells, corresponding to molecular weights of GlyT1 and GlyT2, respectively, which was also very similar to molecular weights displayed by purified FH-GlyT1 and FH-GlyT2 (figures 3c and 3d). Immunoreactivity signal detected for transporters in C6 glioma cells was very weak, indicating a low amount of transporter expression in these cells. Use of this experimental approach made it obvious that endogenous GlyT1 and GlyT2 expression in C6 glioma cells is very low when compared to levels of a stable expression system, such as positive control used (PAE cells). To evaluate tested antibodies specificity, we purified FH-GlyT1 and FH-GlyT2 from stable cell lines by double affinity chromatography. Purified GlyT1 and GlyT2 were divided into two tubes and then loaded into two western blots as diagram indicates (figure 3e). Immunoblots were incubated with selective antibodies to GlyT1 or GlyT2 (figure 3f). Not surprisingly, GlyT1 antibody selectively detected only FH-GlyT1, while GlyT2 antibody specifically detected FH-GlyT2, which supports antibodies specificity.
|
|
|
 |
|
|
Figure 3. Immunoprecipitation of GlyT1 or GlyT2 from C6 glioma cells total lysates.
Source: Author’s own elaboration. |
|
Figure 3. Immunoprecipitation of GlyT1 or GlyT2 from C6 glioma cells total lysates.
Source: Author’s own elaboration. Close |
Schematic representations of N-terminal Flag, His-tagged GlyT1 (a) and GlyT2 (b) are shown. FH-GlyT1 (c) and FH-GlyT2 (d) were purified from PAE cells in a 60 mm tissue culture dish and loaded as positive controls in the first lane of each western blot. Immunoprecipitated GlyT1 and GlyT2 from C6 glioma cells grown on a 100 mm tissue culture dish were loaded in second lane. Antibodies selectivity was validated by purifying FH-GlyT1 and FH-GlyT2 using double affinity chromatography (e) as described in methods. Purified proteins were spread into two western blots (f). As shown, antibodies were highly-selective for detecting FH-GlyT1 and FH-GlyT2. Solid lines follow GlyT1 and dotted lines follow GlyT2 (Vargas-Medrano et al., 2011).
Detection GlyT1 and GlyT2 in C6 glioma cells by confocal microscopy
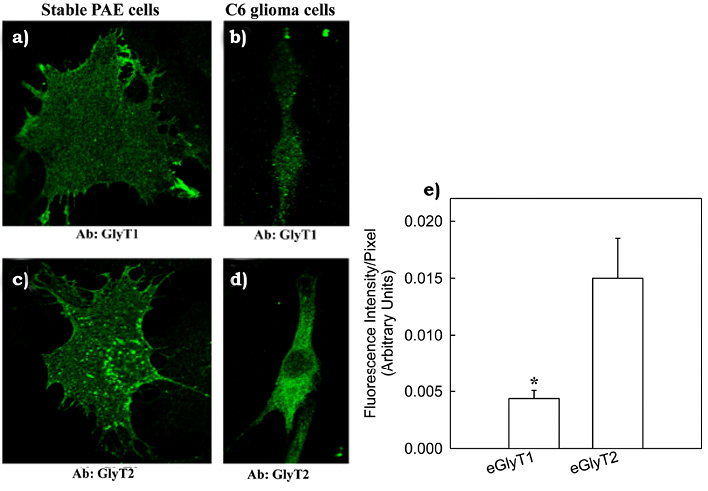
In order to further support our previous findings about endogenous expression of GlyT1 and GlyT2 in C6 glioma cells, were conducted an immunofluorescence staining using highly selective GlyT1 and GlyT2 antibodies followed by confocal microscopy analysis of stained cells. Endogenous GlyT1 and GlyT2 were both detected in C6 glioma cells (figures 4a and 4b). In addition, a positive control was performed by staining PAE cells stably expressing GlyT1 or GlyT2 (figure 4c and 4d). To further investigate levels of GlyT expression in C6 glioma cells, was performed a quantitative analysis of stained C6 glioma cells using the ZEN software (Zeiss). Results showed that endogenous GlyT2 immunofluorescence signal was ~2 folds higher than the signal detected for endogenous GlyT1 (figure 4e).
|
|
|
 |
|
|
Figure 4. Visual detection of the endogenous GlyT1 and GlyT2 in C6 glioma cells.
Source: Author’s own elaboration. |
|
Figure 4. Visual detection of the endogenous GlyT1 and GlyT2 in C6 glioma cells.
Source: Author’s own elaboration. Close |
Immunofluorescence staining of GlyT1 (a) or GlyT2 (b) with selective antibodies in C6 glioma cells is shown. As positive controls, PAE cells stably expressing FH-GlyT1 (c) and FH-GlyT2 (d) were immunostained and are shown in corresponding panels. In panel E, a quantitative plot of fluorescence intensity by C6 glioma cells for staining of endogenous GlyT1 and GlyT2 is shown indicating that endogenous GlyT2 (eGlyT2) is expressed in higher amounts when compared to endogenous GlyT1 (eGlyT1). Bars represent the mean ± SE, n = 10. *, p = 0.025 when compared to eGlyT2 (Vargas-Medrano et al., 2011).
DISCUSSION
High-affinity glycine transporter 1 (GlyT1) has been proposed to be a good candidate as a pharmacological target in chizophrenia treatment with several research groups devoting their efforts into studying pathways involved in regulation of GlyT1 activity and function (Gomeza et al., 1995; Harvey & Yee, 2013; Morioka et al., 2008). It is well accepted that GlyT1 is downregulated by phorbol ester (PMA) (a Protein Kinase C [PKC] stimulator), and PKC inhibition blocks PMA effect, which demonstrated that this process involved PKC signaling (figure 1) (Fernández-Sánchez, Martínez-Villarreal, Giménez & Zafra, 2009; Sato et al., 1995; Vargas-Medrano et al., 2011). This mechanism is similar to that observed for other members of solute carrier 6 (SLC6) family of neurotransmitters transporters (Mirandaet al., 2007; Miranda, Wu, Sorkina, Korstjens & Sorkin, 2005). Similar results have been found in other models such as a retina (Pérez-León, López-Vera & Salceda, 2004). Although C6 glioma cells have been used as a model for GlyT1 function study (Gomeza et al., 1995; Morioka et al., 2008), we aimed to fully validate this cell line as a model to study endogenous GlyT2 for use in future investigations. Our initial pharmacological analysis using a selective concentration of XLA-5407 and XLA-1393 inhibitors supported our hypothesis that GlyT2 is endogenously expressed in C6 glioma cells along with GlyT1 (figures 2a and 2b). Previously, evidence for expression of GlyT1 but not GlyT2 in C6 glioma cells was shown (Gomeza et al., 1995). In addition, we validated how selective inhibitors to GlyT1 or GlyT2 where, using a cell line with stable expression of GlyT1 or GlyT2 (figures 2c and 2d). Indeed, inhibitor concentrations used by us in this study showed to be highly-selective to GlyT1 or GlyT2. Nevertheless, immunoprecipitation and immunoblotting analysis of GlyT1 or GlyT2 revealed a low amount of endogenous transporter expressed in C6 glioma cells (figures 3c and 3d), which led us to believe that this model may not be viable in future studies, or is at least in a big disadvantage when compared to stable cell lines that were used previously in our group (Vargas-Medrano et al., 2011) or by other groups (Pérez-León et al., 2007). Although results appear to show bands of different molecular weight, this can be explained by posttranslational modifications occurrence. Both transporters are known to undergo glycosylation, ubiquitination, and phosphorylation, all of which can cause changes in migration on SDS-PAGE assays and therefore influence observed molecular weight of the protein when analyzed by western blot (Evans et al., 1999; Sato et al., 1995; Vargas-Medrano et al., 2011). Immunofluorescence staining with specific antibodies to GlyT1 or GlyT2 followed by confocal microscopic analysis further supports notion that both GlyT1 and GlyT2 are expressed in C6 glioma cells (figures 4a-4d), and a quantitative analysis of fluorescence intensity of stained C6 glioma cells reveals that endogenous GlyT2 is expressed ~2 folds higher than GlyT1 (figure 4f). This is in disagreement with literature, which only reports presence of GlyT1 (Gomeza et al., 1995; Pearlman et al., 2003). Our group has previously used immunostaining of cells to successfully determine localization of GlyT1 in plasma membrane (Vargas-Medrano et al., 2011). The same approach has been employed for other neurotransmitter transporters (Sorkina et al., 2006).
CONCLUSIONS
Taken together, our data demonstrated that C6 glioma cells express a mixed pool of GlyTs (GlyT1 and GlyT2) in a low but detectable amount. Results provided in this study suggest that caution should be exercised when using C6 glioma cell line as a model for endogenous GlyTs study, since both proteins are present in this cell line. Proper biochemical and pharmacological controls should be employed when attempting to study GlyTs using this C6 glioma cells.
ACKNOWLEDGEMENTS
We thank the Cell Culture and High Throughput Screening staff, Biomolecule Analysis, and Genomic Analysis Core Facilities (University of Texas at El Paso) for support provided. Also want to thank our mentor Dr. Manuel Miranda (University of Texas at El Paso) for his support and training.
REFERENCES
Aprison, M. H., Shank, R. P., & Davidoff, R. A. (1969). A comparison of the concentration of glycine, a transmitter suspect, in different areas of the brain and spinal cord in seven different vertebrates. Comparative Biochemistry and Physiology, 28(3), 1345-1355.
Aragón, C., & López-Corcuera, B. (2003). Structure, function and regulation of glycine neurotransporters. European Journal of Pharmacology, 479(1-3), 249-262.
Aroeira, R. I., Sebastião, A. M., & Valente, C. A. (2013). GlyT1 and GlyT2 in brain astrocytes: expression, distribution and function. Brain Structure and Function, 219(3), 817-830.
Atkinson, B. N., Bell, S. C., De Vivo, M., Kowalski, L. R., Lechner, S. M., Ognyanov, V. I., Tham, C. S., Tsai, C., Jia, J., Ashton, D., & Klitenick, M. A. (2001). ALX 5407: a potent, selective inhibitor of the hGlyT1 glycine transporter. Molecular pharmacology, 60(6), 1414-1420.
Aubrey, K. R., & Vandenberg, R. J. (2001). N[3-(4'-fluorophenyl)-3-(4'-phenylphenoxy)propyl]sarcosine (NFPS) is a selective persistent inhibitor of glycine transport. British Journal of Pharmacology, 134(7), 1429-1436.
Betz, H., Gomeza, J., Armsen, W., Scholze, P., & Eulenburg, V. (2006). Glycine transporters: essential regulators of synaptic transmission. Biochemical Society Transaction, 34(1), 55-58.
Bradford, M. M. (1976). A rapid and sensitive method for the quantitation of microgram quantities of protein utilizing the principle of protein-dye binding. Analitycal Biochemistry, 72(1-2), 248-254.
Curtis, D. R., Duggan, A. W., & Johnston, G. A. R. (1971). The specificity of strychnine as a glycine antagonist in the mammalian spinal cord. Experimental Brain Research, 12(5), 547-565.
Davidoff, R. A., Aprison, M. H., & Werman, R. (1969). The effects of strychnine on the inhibition of interneurons by glycine and gamma-aminobutyric acid. International Journal of Neuropharmacology, 8(2), 191-194.
Evans, J., Herdon, H., Cairns, W., O’Brien, E., Chapman, C., Terrett, J., & Gloger, I. (1999). Cloning, functional characterisation and population analysis of a variant form of the human glycine type 2 transporter. Federation of European Biochemical Societies Letters, 463(3), 301-306.
Fernández-Sánchez, E., Martínez-Villarreal, J., Giménez, C., & Zafra, F. (2009). Constitutive and regulated endocytosis of the glycine transporter GLYT1b is controlled by ubiquitination. Journal of Biological Chemistry, 284(29), 19482-19492.
Gomeza, J., Zafra, F., Olivares, L., Giménez, C., & Aragón, C. (1995). Regulation by phorbol esters of the glycine transporter (GLYT1) in glioblastoma cells. Biochimica et Biophysica Acta (BBA)-Biomembranes, 1233(1), 41-46.
Harvey, R. J., & Yee, B. K. (2013). Glycine transporters as novel therapeutic targets in schizophrenia, alcohol dependence and pain. Nature Reviews Drug Discovery, 12(11), 866-885.
Huff, R. A., Vaughan, R. A., Kuhar, M. J., & Uhl, G. R. (1997). Phorbol esters increase dopamine transporter phosphorylation and decrease transport Vmax. Journal of Neurochemistry, 68(1), 225-232.
Johnson, J. W., & Ascher, P. (1987). Glycine potentiates the NMDA response in cultured mouse brain neurons. Nature, 325(6104), 529-531.
Laemmli, U. K. (1970). Cleavage of structural proteins during the assembly of the head of bacteriophage T4. Nature, 227(5259), 680-685.
Legendre, P. (2001). The glycinergic inhibitory synapse. Cellular and Molecular Life Sciences CMLS, 58(5-6), 760-793.
Miranda, M., Dionne, K. R., Sorkina, T., & Sorkin, A. (2007). Three ubiquitin conjugation sites in the amino terminus of the dopamine transporter mediate protein kinase C-dependent endocytosis of the transporter. Molecular Biology of the Cell, 18(1), 313-323.
Miranda, M., Wu, C. C., Sorkina, T., Korstjens, D. R., & Sorkin, A. (2005). Enhanced ubiquitylation and accelerated degradation of the dopamine transporter mediated by protein kinase C. Journal of Biological Chemistry, 280(42), 35617-35624.
Morioka, N., Abdin, J. M., Morita, K., Kitayama, T., Nakata, Y., & Dohi, T. (2008). The regulation of glycine transporter GLYT1 is mainly mediated by protein kinase Cα in C6 glioma cells. Neurochemistry International, 53(6-8), 248-254.
Olivares, L., Aragón, C., Giménez, C., & Zafra, F. (1997). The role of N-glycosilation in the targeting and activity of the GlyT1 glycine transporter. Journal of Biological Chemistry, 270(16), 9437-9442.
Pearlman, R. J., Aubrey, K. R., & Vandenberg, R. J. (2003). Arachidonic acid and anandamide have opposite modulatory actions at the clycine transporter, GlyT1a. Journal of Neurochemistry, 84(3), 592-601.
Pérez-León, J., López-Vera, E., & Salceda R (2004). Pharmacological properties of glycine transport in the frog retina. Neurochemical Research, 29(1), 313-318.
Sato, K., Adams, R., Betz, H., & Schloss, P. (1995). Modulation of a recombinant glycine transporter (GLYT1b) by activation of protein kinase C. Journal of Neurochemistry, 65(5), 1967-1973.
Sorkina, T., Miranda, M., Dionne, K. R., Hoover, B. R., Zahniser, N. R., & Sorkin, A. (2006). RNA interference screen reveals an essential role of Nedd4-2 in dopamine transporter ubiquitination and endocytosis. The Journal of Neuroscience, 26(31), 8195-8205.
Torres, G. E., Gainetdinov, R. R., & Caron, M. G. (2003). Plasma membrane monoamine transporters: structure, regulation and function. Nature Reviews Neuroscience, 4(1), 13-25.
Towbin, H., Staehelin, T., & Gordon, J. (1979). Electrophoretic transfer of proteins from polyacrylamide gels to nitrocellulose sheets: procedure and some applications. Proceedings of the National Academy of Science, 76(9), 4350-4354.
Vargas-Medrano, J., Castrejón-Téllez, V., Plenge, F., Ramírez, I., & Miranda, M. (2011). PKCβ-dependent phosphorylation of the glycine transporter 1. Neurochemistry International, 59(8), 1123-1132.
Yamashita, A., Singh, S. K., Kawate, T., Jin, Y., & Gouaux, E. (2005). Crystal structure of a bacterial homologue of Na+/Cl- -dependent neurotransmitter transporters. Nature, 437(7056), 215-223.
Zafra, F., Alcántara, R., Gomeza, J., Aragón, C., & Giménez C. (1990). Arachidonic acid inhibits glycine transport in cultured glial cells. Biochemical Journal, 271(1), 237-242.
Zafra, F., Aragón, C., & Giménez, C. (1997). Molecular biology of glycinergic neurotransmission. Molecular Neurobiology, 14(3), 117-142.
Zafra, F., Aragón, C., Olivares, L., Danbolt, N. C., Giménez, C., & Storm-Mathisen, J. (1995). Glycine transporters are differentially expressed among CNS cells. The Journal of Neuroscience, 15(5), 3952-3969.
Zafra, F., & Giménez, C. (1989). Characteristics and adaptive regulation of glycine transport in cultured glial cells. Biochemical Journal, 258(2), 403-408.